

40+ years helping financial professionals stay ahead of market trends. We do not reply to DMs/comments. For support, visit https://teapaw.org/t.co/nXEDyR00YV.
- Tweets26.2K
- Following291
- Followers122K
- Likes3.2K
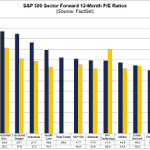


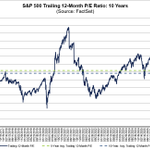


ALT Chart showing S&P 500 Forward 12-Month P/E Ratio over 25 years. The line fluctuates, peaking before declining. A dashed yellow line indicates the 25-year average. Data source: FactSet.

ALT Screenshot of a webpage titled "U.S. ETF Monthly Summary: October 2026 Results" from FactSet Insight. The page highlights a total of $16.5 trillion in U.S.-listed ETFs, with October having a 45% increase from September, collecting $204.2 billion. The author, Lois Gregson, is noted at the bottom.

ALT This image shows a dark-themed financial analysis chart. At the top, there's an efficient frontier graph with dots representing various portfolios and asset classes like US Equity and Fixed Income. Below, a stacked area chart displays portfolio weights. On the right, a table lists returns, risks, and optimal values for different asset classes.

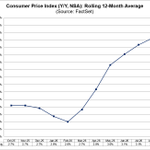
ALT The line graph displays the 12-month rolling average of the Consumer Price Index (Year over Year, Not Seasonally Adjusted) from October 2025 to September 2026. The data is sourced from FactSet. The graph shows a slight decrease from 2.75% to around 2.65% between October 2025 and February 2026, followed by a steady rise to approximately 3.23% by September 2026.

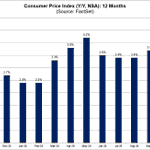
ALT Bar chart titled "Consumer Price Index (Y/Y, NSA): 12 Months" from FactSet. Vertical axis displays percentages from 0% to 5%. Horizontal axis lists months from November 2025 to October 2026. Each month shows a blue vertical bar representing the CPI percentage, with May 2026 peaking at 4.2% and some variability throughout the year, ending at 4.0% in October 2026.


ALT Banner for FactSet Insight displaying the title "Metals & Mining: Global Drill Results Monitor." Text mentions capturing copper and gold drill results from over 1,000 properties and highlights significant projects and regions. The author's name, Banu Nadarajah, is included.


ALT Title: FactSet Insight Description: A FactSet Insight webpage focused on risk, performance, and reporting. The headline reads, "From Conversation to Application: When a Portfolio Workflow Should Become a Tool," followed by a paragraph discussing AI-enabled conversational portfolio construction. There's a "Read More" link and the name Georgi Mitov at the bottom.


