
Science and Web Analytics. Our aim is to help our clients to boost their communication and publication channels.
Spain
Joined September 2009
- Tweets4.3K
- Following181
- Followers9.6K
- Likes260




Brazil consolidates its scientific leadership in Latin America, securing 6 spots among the region's top 10. Explore the leading institutions in the SCImago Institutions Rankings (SIR) 👇
At SIR, we replace "black box" methodologies with tangible intelligence through 20 open and auditable indicators evaluating the complete institutional mission across Research, Innovation, and Societal Impact.
Move from monitoring to strategic decision-making. Mitigate scientific integrity risks and drive your global standing with a comprehensive diagnostic evaluation through the IRIS technical framework:👇
🔗 scimagoir.com/rankings.php?s…
#SIR #Universities #SCImagoInsigh
@usponline @UNAM_MX @ufrj @uchile @ucatolica
@UBAonline

ALT Top 10 highest-ranked universities Latin America
How can institutions and publishers spot research integrity vulnerabilities when rising publication volumes make case-by-case review insufficient?
While manuscript screening is essential, looking beyond isolated cases reveals where issues repeatedly emerge. SCImago IRIS (for Institutions & Journals) analyzes authorship, citation, and retraction indicators to identify patterns that warrant closer attention.
Read our blog 👇scimagolab.com/research-inte…
#ResearchIntegrity #SCImagoIRIS

Failures in research integrity are expensive—but what does it actually cost to prevent and address them?
In our blog, we examines the human and financial investment required to keep the scientific record reliable, and why AI screening tools don’t replace the need for expert editorial judgment.
Do you have concerns about how to analyze scientific risk patterns? Contact us and we will guide you in detecting vulnerabilities with SCImago IRIS.
Read the post here 👇🔗 scimagolab.com/cost-of-maint…
#ResearchIntegrity #SCImagoIRIS

The key economic question in research integrity isn't just how much universities and publishers spend, it's whether those resources are directed where they make the greatest impact.
With rising publication volumes, SCImago IRIS for Institutions & Journals helps organizations identify macro-level patterns that warrant closer attention, informing smarter decisions on training, oversight, and investigative capacity.
Read part 2 of our blog series 👇🔗scimagolab.com/cost-of-maint…
#ResearchIntegrity #SCImagoIRIS
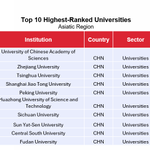
The Middle East is rapidly expanding its scientific footprint and global research capacity. Examine the top 10 universities leading the region in the SCImago Institutions Rankings (SIR) 👇
True regional leadership requires balancing high research output with sustainable governance. At #SIR, we transform evidence-based data into tangible intelligence through 20 open and auditable metrics across Research, Innovation, and Societal Impact.
For the full list, head to: scimagoir.com/rankings.php?c…
@KSU_English @TelAvivUni @KAUST_News @kauedu_sa @WeizmannScience @QatarUniversity
@CairoUniv @HebrewU @ut_newsline

#ChartOfTheWeek | How do publication volume and citation impact interact across the Arab scientific ecosystem? 🧵
In this #ChartOfTheWeek, we analyze the scientometric cartography of SCImago Arab. The data reveals that higher output volume does not automatically translate into greater visibility, highlighting specific regional clusters that exceed the global citation average by 27%. 👇

The chromatic scale sets the regional average for
Normalized Impact at 1.27:
Blue clusters (reaching up to 4.99 across the Arabian Peninsula and the Nile Valley) demonstrate strong international visibility and high citation traction.
Pink nodes (starting at 0.05) highlight institutional and regional ecosystems facing structural challenges in international co-authorship and citation impact.
Institutional performance cannot be captured through a single metric.
Using the selector at the bottom right of the display, research policy managers and editors can choose among 20 available indicators to redefine the size and color of the bubbles, enabling customized profiling across innovation, societal impact, and scientific leadership.
Explore the interactive cartography and institutional positioning profiles at SCImago Institutions Rankings (SIR) and SCImago Graphica. 🔗scimagoarab.com/regions.php
#ChartOfTheWeek #SCImagoARAB
1
23
Visualizing scientific data is key to understanding the performance of journals and countries. 📊
With the SCImago Compare tool, you can simultaneously analyze up to 6 publications or countries, contrasting their key bibliometric indicators using dynamic charts.
Explore now 🔗scimagojr.com/viztools.php
#SCImagoCompare #SCImagoTools #VizTools

ALT SCImago viz tool - Journal Comparison

ALT SCImago viz tool - Country and region comparison
SCImago retweeted

Some data stories are best told in motion. Starting today, any chart in @scimago Graphica can move.
We're launching two new features I'm especially excited about:
If research integrity fails, it's very expensive. But what does it cost to prevent and address it?
Our new post explores the human and financial investment needed to keep the scientific record reliable, and why AI doesn’t replace expert judgment.
When papers with fabricated data reach peer review, valuable academic time is wasted. While reviewers can't catch every issue, #SCImagoIRIS for Journals helps publishers spot broader patterns in authorship, citations, and retractions, guiding where editorial oversight is needed most.
Do you have concerns about how to analyze scientific risk patterns? Contact us and we will guide you in detecting vulnerabilities. Read our blog here: 👇scimagolab.com/cost-of-maint…
#SCImagoIRIS #ResearchIntegrity
What is the true economic cost when research integrity fails? 📉
When we discuss research misconduct, we focus on ethics and trust—but rarely on the massive resources already spent by the time a problematic article is retracted.
As Gali Halevi explains in our new blog post, a single compromised paper consumes investments across the entire ecosystem:
1️⃣ Grant funding, labs and salaries
2️⃣ Editorial screening and peer reviewers' institutional time
3️⃣ Publishing infrastructure, post-publication investigations and legal review
Rather than waiting for individual incidents to reveal wider concerns, SCImago IRIS for Institutions and IRIS for Journals help identify broader publication patterns that warrant early attention.
Read part 1 of the series here 👇
scimagolab.com/the-economic-…
#ResearchIntegrity #ScimagoIRIS #SCImagoBlog

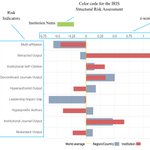
#ScimagoIRIS | Research integrity is managed with data and strategic governance.
SCImago IRIS is a non-punitive early-warning tool that uses a dynamic set of indicators and Z-score normalization to help institutions proactively detect their exposure to scientific risks. By anticipating structural vulnerabilities, it transforms scientometrics into actionable intelligence to support informed leadership decisions.
The credibility of knowledge begins with the capacity to anticipate its risks.
🔍 Explore your institution's broader landscape and request a detailed report 👉scimagoiris.com/integrity-ri…
#SCImagoIRIS #ResearchIntegrity
#ChartOfTheWeek | How are scientific impact and research output distributed across Ibero-America? 🌎
By default, the #SCImagoIBER map visualizes research performance by combining two key dimensions at a glance: ⚪ Size: Research output 🎨 Color: Normalized impact. 🧵👇

This tool aims to support research assessment, strategic planning, and evidence-based policymaking in science and research.
🌐 Explore the platform and institutional profiles here: scimagoiber.com
Northern America sets a high benchmark for global research excellence. Explore the top 10 institutions leading the region in the SCImago Institutions Rankings (SIR) 👇
At SIR, we transform data into tangible intelligence through 20 open and auditable metrics distributed across three key dimensions: Research, Innovation, and Societal Impact.
Move from monitoring to strategic decision-making. Shift the conversation from "where do we stand?" to "how do we improve?". Access the full ranking and analyze the data behind the leaders: scimagoir.com/rankings.php

How do scientific production and the location of publishers connect around the world?
Exploring the dynamics of global research has never been so visual and intuitive. Today, we want to highlight #CountryGraphs, a powerful tool that allows you to analyze the distribution and relationship of science worldwide through two key variables:
📍 Publisher's country: Where journals are published and indexed (for example, in databases like Scopus).
🔬 Author's affiliation country: Where the scientific research actually originates.
Would you like to integrate this tool into your upcoming bibliometric analyses or literature reviews?
🔗scimagojr.com/countrygraph.p…
Tell us in the comments how you measure research impact in your region! 👇
Who pays the real cost when a problematic article gets published and has to be retracted?
In our new blog, Gali Halevi analyzes how costs accumulate from initial funding and peer review hours to complex subsequent investigations.
Looking beyond isolated cases and using tools like #SCImagoIRIS allows universities and publishers to detect patterns and optimize their integrity resources.
Read the full article here 👇scimagolab.com/the-economic-…
#ResearchIntegrity #SCImagoIris #SCImagoBlog