

The most powerful and intuitive #datavisualisation technology for Microsoft's #PowerBI, #Excel, and #PowerPoint!
Ljubljana, Slovenia
Joined January 2014
- Tweets4.3K
- Following849
- Followers5.3K
- Likes2.6K
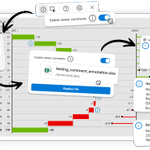



Zebra BI Tables+ and Charts+ bring viewer commenting to Power BI. No edit rights needed.
1. Connect a SharePoint file
2. Viewers comment right on the data
3. Decide where the data is
Comments stay in your Microsoft 365.
Try it: eu1.hubs.ly/H0zg69r0
#PowerBI #FPA #ZebraBI

ALT Zebra BI_Tables+ and Charts+_viewer commenting
Your CFO asks why opex is up in Germany. The data’s in Fabric. The report that answers it doesn’t exist yet.
Zebra AI runs inside Fabric and writes the story, with every figure traceable.
27 Oct, 6pm CET: eu1.hubs.ly/H0zc3Lh0
#PowerBI #AI #MicrosoftFabric

ALT Zebra BI_Webinar
"Within seconds, we can pinpoint where we're losing. Within minutes we know what to do." — Robert Anschütz, Ipsen Pharma.
Read the full story below ⬇️
#ZebraBI #CustomerWins

ALT Zebra BI_Ipsen Pharma_Customer story
Ipsen Pharma story: eu1.hubs.ly/H0yVTNP0

Left: Microsoft's sample report. Right: the same page, rebuilt by an AI agent in #ClaudeCode with #ZebraBI visuals.
Same data. Which one tells you faster where you stand?
On 27 October, we'll show how it was done, step by step, and what's new in #Fabric.
📅 Tuesday, 27 October · 6 pm CET / 1 pm EDT / 10 am PDT
👉 Save your seat: eu1.hubs.ly/H0z01tV0


"With Zebra BI, we created a Board of Directors dashboard giving leadership direct access to the most critical financial data." Kees Leenders, Heijmans.
Read how in the comments. ⤵️
#ZebraBI #PowerBI #CustomerWins

ALT Zebra BI_Heijmans_Customer story

One chart, the whole sales funnel: volume and drop-off at every stage, segment by segment.
Download in the comments. 👇
#ZebraBI #PowerBITemplates

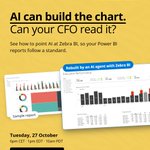
AI can build the chart. Can your CFO read it?
On Oct 27, watch an AI agent rebuild a #PowerBI report with Zebra BI visuals, and see what Zebra AI adds in #MicrosoftFabric. 👉 bit.ly/4huNHK5
Free live webinar, with Q&A.
📅 6pm CET / 1pm EDT / 10am PDT


"Who here uses Zebra BI?"
Andrej asked that on stage at #FabConEurope in Barcelona. Almost every hand in the room went up. 🙌
Thanks to everyone who stopped by booth 56 to see Tables+ and Charts+ and try the new AI agent that builds Power BI reports with Zebra BI.
See you at FabCon 2027! #PowerBI

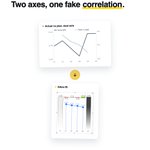
Grand totals on Excel bar charts shouldn't need helper rows and invisible series.
Here's what it looks like done right.
Full video: eu1.hubs.ly/H0ykFGM0
#ZebraBI #DataAnalytics


W.L. Gore story: eu1.hubs.ly/H0y7_dh0


Consolidated financials are where Power BI reports usually get messy.
This template keeps entities side by side with variances calculated automatically.
Download it ⤵️
#ZebraBI #PowerBI #PowerBITemplates
