

#CopernicusMarine Service provides products & services for #marine applications. Funded by #EU @CopernicusEU, Implemented by @MercatorOcean
- Tweets11.7K
- Following3.4K
- Followers15.7K
- Likes6.2K



ALT The image is a promotional graphic with abstract ocean waves and fish silhouettes. The text reads: "Decoding the Ocean, Episode 1 Out Now! Why Ocean Data Matters." Logos for Mercator Ocean International and Copernicus Marine Service are at the bottom.

ALT Podcast cover art titled "Decoding the Ocean." It reads "Episode 2 Out Now! The Blue Economy: How the Ocean Shapes Our Economies.” Features colorful, layered waves with fish silhouettes. Logos of Mercator Ocean International and Copernicus Marine Service are at the bottom.

ALT A promotional image for "Decoding the Ocean" Episode 3, featuring a layered ocean wave design with fish silhouettes. Text reads: "Artificial Intelligence: How AI is Transforming Ocean Knowledge." Logos for Mercator Ocean International and Copernicus Marine Service are visible at the bottom.

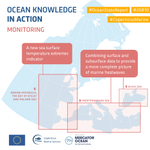
ALT This image is an infographic titled "Ocean Knowledge in Action: Monitoring." It includes a map highlighting the Iberian Peninsula, Bay of Biscay and Ireland, Mediterranean Sea, and Black Sea. Text boxes describe new sea surface temperature extremes indicators and the combination of surface and subsurface data for marine heatwaves. Logos for Copernicus Marine Service and Mercator Ocean International are at the bottom. Hashtags #OceanStateReport, #OSR10, and #CopernicusMarine are at the top.
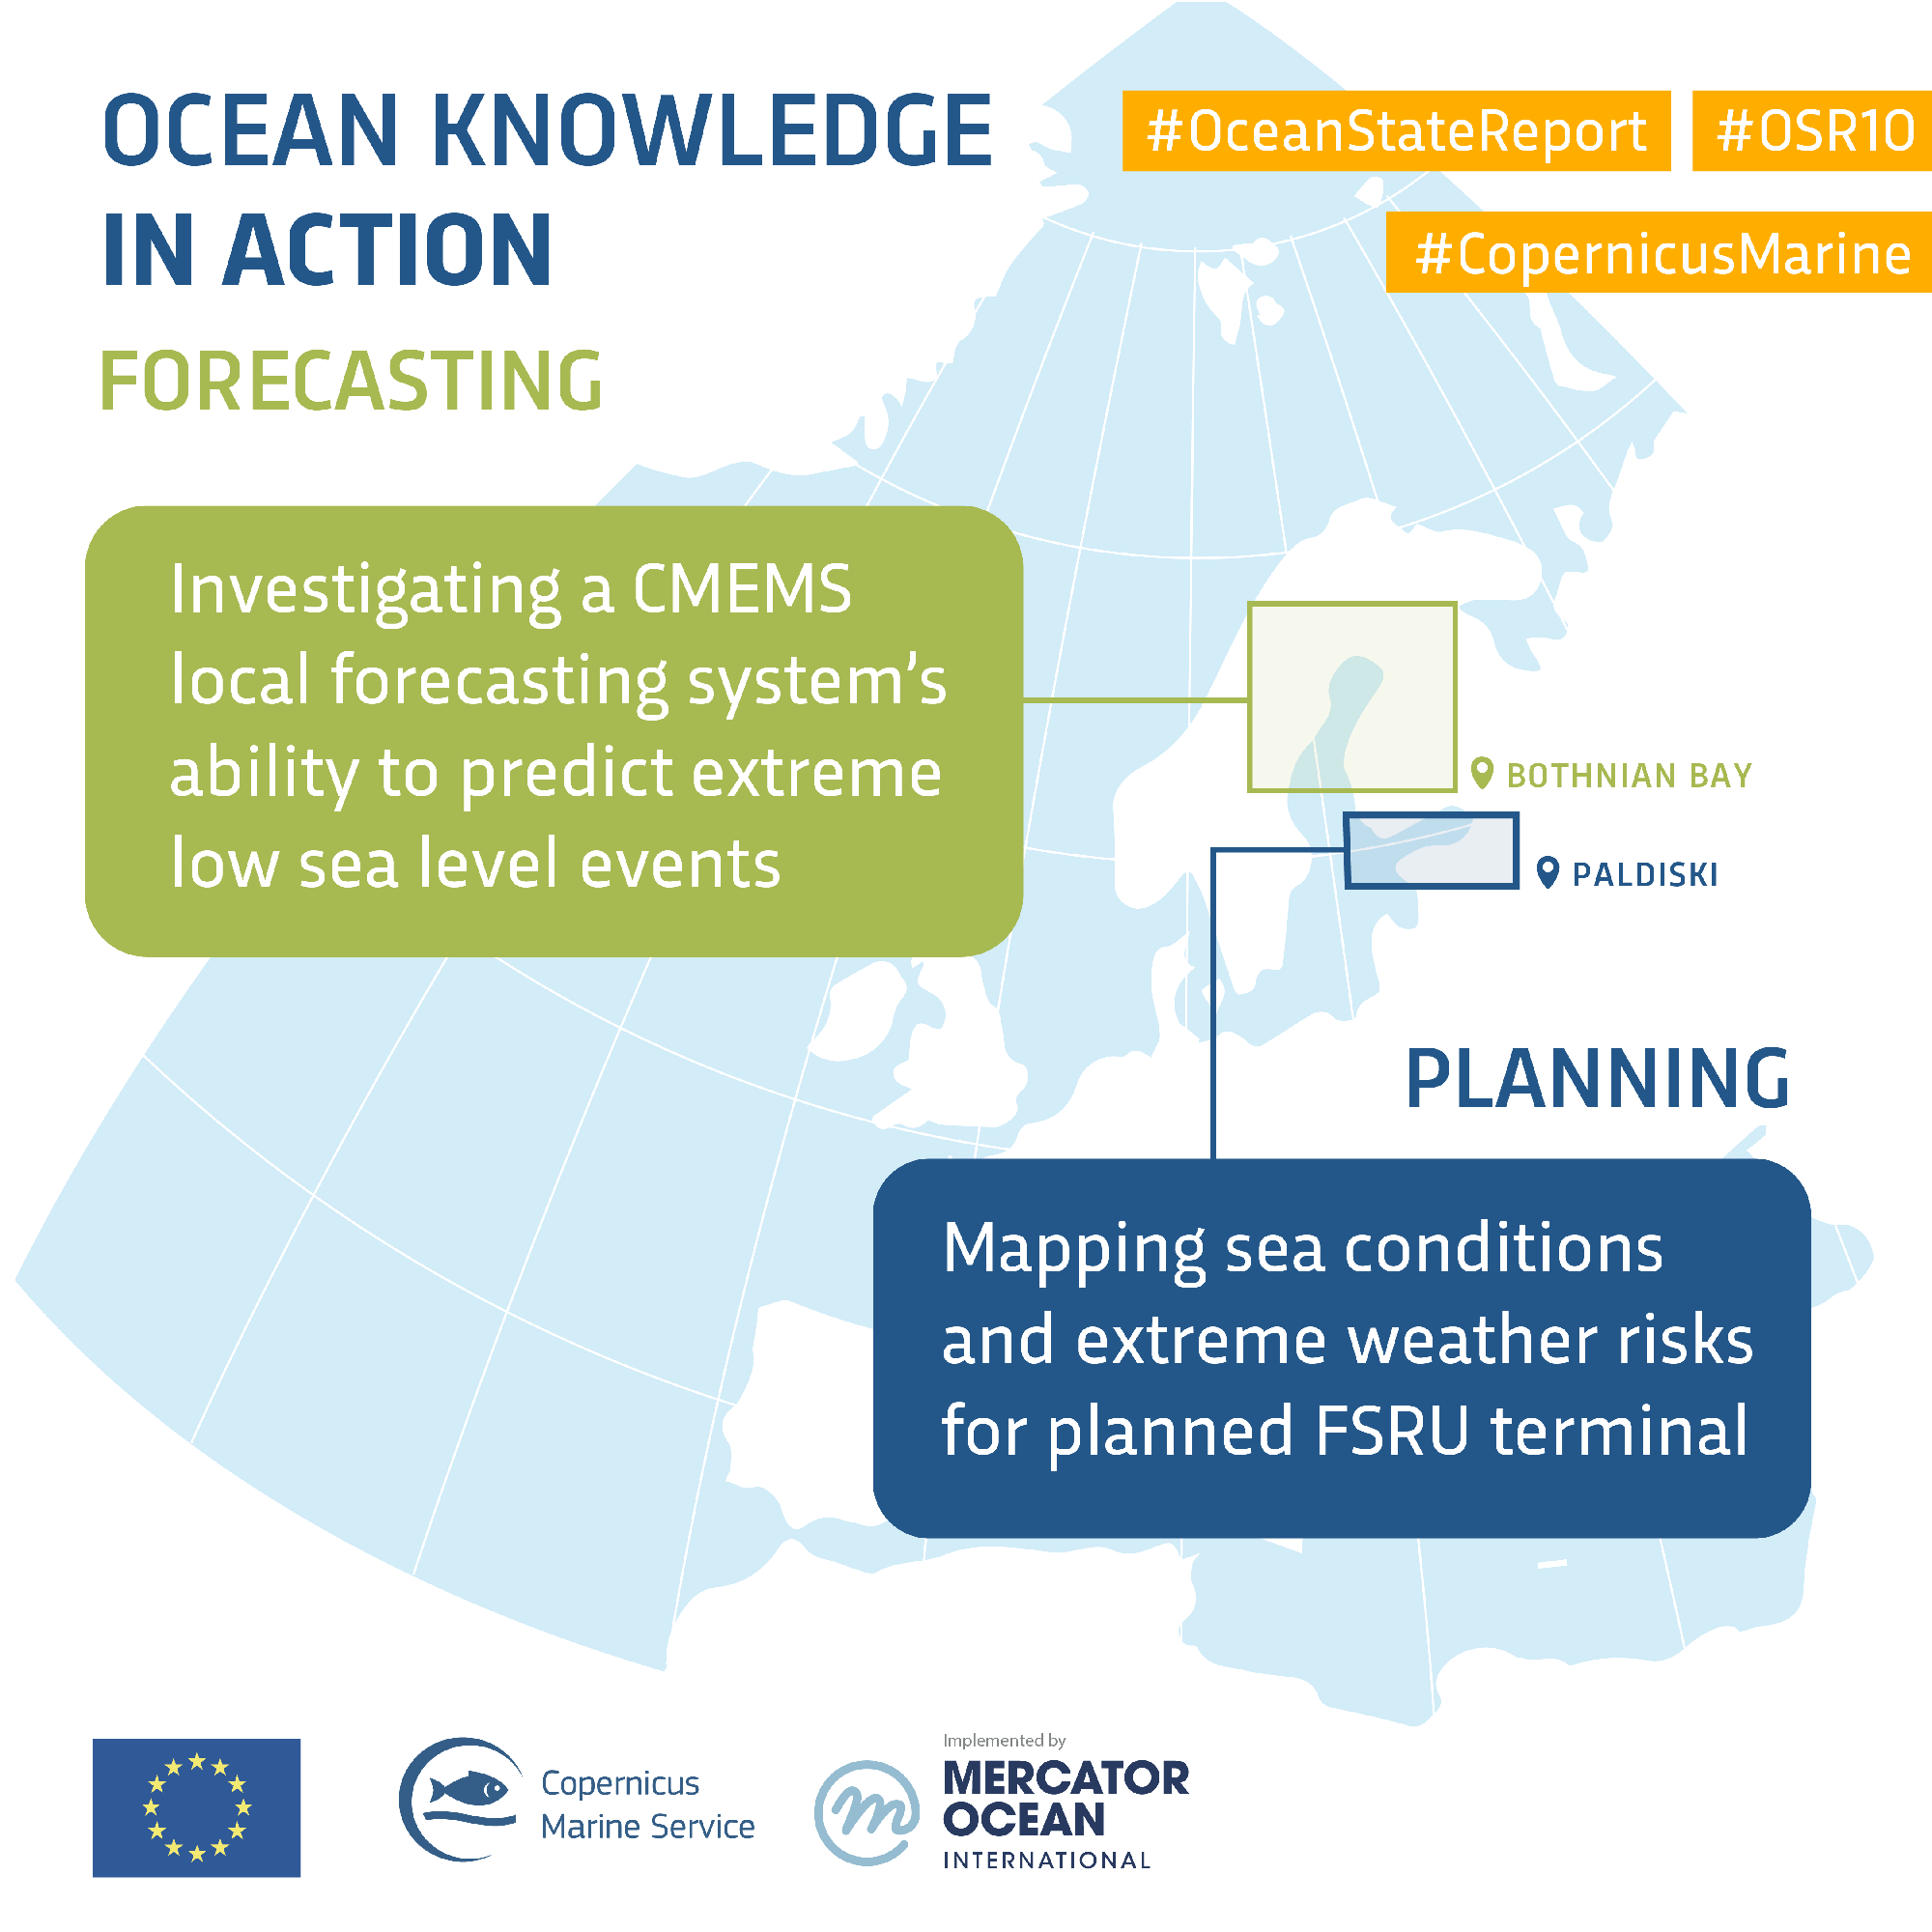
ALT This image is an infographic titled "Ocean Knowledge in Action." It outlines two key activities: "Forecasting" and "Planning." The forecasting section mentions investigating a CMEMS local forecasting system's ability to predict extreme low sea level events. The planning section highlights mapping sea conditions and extreme weather risks for a planned FSRU terminal. The map includes a location marked in the Bothnian Bay near Paldiski. The image features logos of Copernicus Marine Service and Mercator Ocean International, with hashtags #OceanStateReport, #OSR10, and #CopernicusMarine.


ALT A world map displaying sea surface foundation temperatures in Kelvin. The map uses a color gradient from blue (colder) to red (warmer) to show temperature variations across the oceans. Some landforms like North and South America, Europe, Africa, Asia, and Australia are visible. The data source is E.U. Copernicus Marine Service.

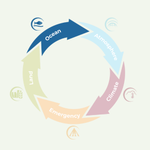
ALT A circular infographic with five arrows illustrating different environmental elements: "Ocean" in blue, "Atmosphere" in light blue, "Climate" in pink, "Emergency" in orange, and "Land" in green. Each segment has an icon representing its theme.

ALT A group of people seated in a well-lit conference room, facing forward. They are seated on chairs, some working on laptops. Tables with white tablecloths hold projectors and notebooks. The room has large windows and unique feather decorations on the ceiling.

ALT The image is a promotional banner for the Copernicus Marine Toolbox Step-by-Step Live Tutorial. It includes details such as the date and time, November 3, 2026, from 10 am to 12 pm CET. The background shows a scenic view of icy mountains and water. Logos of Copernicus Marine Service, Mercator Ocean International, and Noveltis are displayed, alongside the European Union emblem. The event is marked as "Online.

ALT The image is an infographic titled "The Global Ocean is Transforming," detailing changes in ocean conditions. The infographic features Copernicus Marine and Mercator Ocean International logos.


ALT A graphic depicting Antarctica with highlighted text stating that record-low Antarctic sea ice in 2022 coincided with the first mass breeding failure of emperor penguins. Logos for the European Union, Copernicus Marine Service, and Mercator Ocean International are at the bottom. Hashtags #OceanStateReport and #OSR10, and the tag #CopernicusMarine appear at the top.

ALT A map showing the Southern Ocean around Antarctica, highlighting sea ice extent from August to December. Different colored lines indicate penguin colonies, penguin areas, sea ice extent in 2022, and conservation territories. Logos for Copernicus Marine Service, Mercator Ocean International, and related entities are present, along with hashtags #OceanStateReport, #OSR10, and #CopernicusMarine.


ALT This image is a promotional banner for the 10th Ocean State Report at Brussels Climate Week, featuring the Copernicus Marine Service. It mentions a partnership with the European Union, ECMWF, and Mercator Ocean International. The event is scheduled for 10:35 am CEST, 15 October at The Parliament Lounge. The banner includes Dr Karina von Schuckmann from Mercator Ocean International smiling to the right.

ALT This image is an informative graphic about Arctic sea ice. It has text stating that Arctic sea ice has been declining since 1982 and mentions that 60% of coastal infrastructure is vulnerable to erosion and sea-level rise. Hashtags include #OceanStateReport, #OSR10, and #CopernicusMarine, with logos for the European Union, Copernicus Marine Service, and Mercator Ocean International at the bottom.

ALT The image is a map illustrating Arctic permafrost erosion rates. Various colors indicate different erosion rates: pink for slow (0-1m/year), orange for moderate (1-2m/year), and green for rapid erosion (>2m/year). Additional symbols represent permafrost areas and building footprints on permafrost. The map includes logos for the European Union, Copernicus Marine Service, and Mercator Ocean International. Hashtags are present: #OceanStateReport, #OSR10, and #CopernicusMarine.

ALT World map showing sea surface temperature mean anomaly in September 2026. The map features variations in temperature, with a color scale on the right indicating degrees Celsius. Prominent areas of temperature change are visible in the Pacific and Atlantic Oceans. Information is provided by Mercator Ocean International and Copernicus Marine Service, with data labeled as GLO12.


ALT Cover of the "Copernicus Ocean State Report 10" featuring abstract oceanic imagery on the left and the report title text on the right.

ALT A colorful infographic titled "Small Island Developing States (SIDS)" by the Copernicus Marine Service and Mercator Ocean International. It lists challenges faced by SIDS such as ocean warming, sea level rise, and impacts on coral reefs and tropical cyclones. The infographic highlights that SIDS govern vast ocean areas, rely on marine ecosystems, and are vulnerable to climate change. It also notes impacts on infrastructure, welfare, and economy. Hashtags include #OceanStateReport, #OSR10, and #CopernicusMarine.

ALT A hand holding a compass is featured in the foreground of the Copernicus Marine Service Hackathon 2026 poster. The poster highlights "Theme 6: Ocean governance and international cooperation" with points on data-driven governance, cross-sector coordination, and stakeholder participation. Logos for Copernicus Marine Service and Ultra Hack are present. Registration deadline is October 11th, 2026.