

Obsessed with charts, swing trading, and being a dad. Chief Sniper @MarketSniperPro Hobbying @ClosingLineUS
Discord, Alerts, & Indicators
Joined April 2009
- Tweets51.7K
- Following1.2K
- Followers84.2K
- Likes80.1K


Pinned Tweet
NASDAQ has dropped -13% in the past 21 trading days.
The trap was set for the bulls October 6th, 2026 just like they set the trap on October 6th, 2025 for Bitcoin.
Exactly one year later was not in my magic crystal ball...


VanEck Bitcoin Trust (HODL) just filled another gap.
"If price fills the $19.71 gap, then $BTC will be at $70,000."
Current price is: $72,680

If VanEck Bitcoin Trust (HODL) fills the $19.71 gap, then $BTC will be at $70,000.
"Not all gaps get filled but they work great as targets"
How many gaps will get filled?

$SOL just hit all four targets drawn one month ago.
Text book retracement after price was overbought. Now price is oversold and we'll see about a reversal to the upside.
Grab the popcorn.

$SOL has a pending sell signal on the daily chart.
Yesterday there was a candle close below the trending dots.
"At least a retest of the blue line" ✅

$ETH just hit all four targets to the downside as price wicked to $2,000.
Reversal signs were there: Overbought candles, Bearish divergence, sell signal, etc...
Bulls need to find support here or there is another yellow line lurking at $1,338.10. 👀

$ETH is flashing a pending sell signal and a pending RSI sell signal on the daily chart.
Long liquidation clusters align with blue line at $2,528.
Retracement in progress.

BREAKING: $BTC has just hit target three. ✅
Bulls will need to step in quickly or we'll see target four also get hit.

The bearish signal went out before the big drop, that's the whole game.

Members got a bearish signal on $FTNT on October 7.
Down 37.2% over the next 30 days.

$BTC remains bearish on the daily chart.
200-day SMA is sitting at $73,142 and has not been retested since August 20th.
Two months after price broke above it in January 2023, price retested it, and then V-shape recovered.
Retest and V-shape?


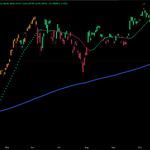
NASDAQ remains bearish on the daily chart.
Expect bounces along the way, expect price to let the trending dots catch-up.
How low will price go?

Just a matter of time before $SNDK was going to hit the yellow line. ✅
Candles were oversold, key level, and pending reversal signal. Expect bounces along the way, small gaps above.
Another banger call. 🤝

$SNDK relief rally was expected and now it's over.
Pump -> Drop -57% -> Relief rally -> Bigger drop
$742 is loading, time is running out.

$PLTR has hit three of five shorter-term targets so far.
Drop -> Hit targets -> Oversold -> Retest trending dots
The massive 12.8% gap at $126.97 will get filled sooner rather than later.

$PLTR is about to flip bearish on the daily.
Already in:
Bearish divergence
Overbought candles
Reversal candle
Waiting on:
Actual sell signal
The lower high to confirm
Targets are marked. Unfilled gaps below.

$BTC leverage liquidation map of longs vs. shorts.
Shorts continue to pile up and outweigh longs by $10B.
Daily chart is still bearish, but is a short squeeze developing?

$MU has hit all four targets to the downside.
Thursday produced an oversold candle.
Most likely scenario: Retest trending dots, then lower.

$MU has a pending sell signal on the daily chart.
Three of four targets have been hit to the downside so far. Targets are still valid from the June top.
Retest target two in progress.

$RKLB has a pending buy signal on the daily chart.
Recap:
-71% drop in 5 months
Oversold candles
Bullish divergence
A higher low is the higher probability of a reversal.

$NVDA has crashed -30% since October 6th.
"Top is in and a deeper correction has begun."
All five shorter-term and two longer-term targets have been hit so far.
News came out yesterday.

$NVDA top is in and a deeper correction has begun.
Last week, we saw a sell signal and close below trending dots.
This week, longer-term target one was hit, follow through to the downside, and a close below the upward sloping trend line from April.
Signs were there.

$BTC dropped to $73,400 and nearly hit target three.
First candle close below the pivot point and key support level (blue line).
Leveraged long liquidation clusters just below.

Is Silver lagging Gold timewise?
Signs of a reversal similar to Gold: Oversold candles + Reversal candles + Price back above downward trend line
If lagging, then we'll see a pending buy signal in the near future.

PENDING buy signal on Gold daily chart.
Signs of a reversal were there: Oversold candle + Price closed below support trapping bears + Reversal candle
In the past couple of trading days, price broke out, closed above the trending dots and is pushing higher.

