

Peer-reviewed, open access journal. Novel case reports, articles, images, etc — for the field of Pediatric Gastroenterology, Hepatology, Pancreas, Nutrition.
- Tweets1.4K
- Following82
- Followers1.2K
- Likes951





ALT ROC curve showing the performance of faecal calprotectin at end of induction in predicting switch to an alternative biologic at 2 years (AUC 0.88, 95% CI 0.71–1.00). The optimal cutoff of 305 µg/g represented by the red ‘X’ provided 100% sensitivity and 77.3% specificity, with a positive predictive value of 36% and a negative predictive value of 100%. AUC, area under the curve; CI, confidence interval; ROC, receiver operating characteristic.

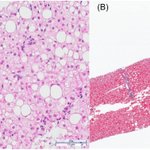
ALT Hematoxylin and eosin and trichrome stains of liver biopsy. (A) Liver core biopsy showing mild macrovesicular steatosis (20%–30% of hepatocytes). (B) A trichrome stain shows normal architecture and no increased fibrosis.

ALT Treatment preferences for rectal stump disease recurrence ranking. Weighted Scoring System: Participants ranked choices in order of likelihood. 1st choice-position responses receiving the highest weight. The weighted values were adjusted to match the number of choices selected and the scores were calculated on that basis. 0—Least likely to use, 10—Most likely to use.

ALT Post-HPE adjuvant treatments. BA, Biliary atresia; BOLD, efficacy and safety of odevixibat in children with BA who have undergone a Kasai HPE; EMBARK, evaluation of maralixibat in BA response post-Kasai; CARE, obeticholic acid in pediatric subjects with BA; HPE, hepatic portoenterostomy. Prepared by the authors (2025).

ALT Esophageal findings via single-use ultraslim gastroscope and standard gastroscope. Grade I varices identified via ultraslim endoscope (A1) and standard gastroscope (A2). Grade II varices identified via ultraslim endoscope (B1) and standard gastroscope (B2). Grade III varices identified via ultraslim endoscope (C1) and standard gastroscope (C2).

ALT Homozygosity of CoDE and VEOIBD cohort. (A) Percentage of consanguinity between CoDE, VEOIBD and control cohort. (B) Homozygous regions identified in Chromosome 2 by using whole exome sequencing and segregating within the family (homozygosity mapping) of Patient AD3 with an EPCAM mutation. CoDE, congenital diarrheas and enteropathies; VEOIBD, very early onset inflammatory bowel disease.


ALT Shared biopsychosocial formulation and interventions. IBD, inflammatory bowel disease.

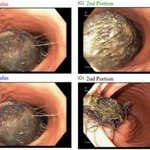
ALT Endoscopic view of gastric bezoar extending into duodenum. (A) Fundus: Large bezoar occupying the gastric fundus. (B) Fundus: Bezoar in the gastric fundus with visualization of the gastric wall. (C) 2nd Portion: Bezoar migrated into the second portion of the duodenum, filling the lumen. (D) 2nd Portion: Bezoar within the second portion of the duodenum during endoscopic retrieval.


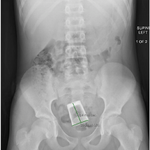
ALT Abdominal radiography demonstrating a retained rectal foreign body.

ALT Select MRCP images of the abdomen, pre- and post-chemotherapy. (A) Axial T1 fat-saturated, contrast-enhanced image showing lobulated, hypo-enhancing mass in the pancreatic head measuring 4 cm (arrow) and displacing adjacent structures; (B) Coronal T2-weighted image showing dilated common bile duct (arrow); (C) Post-chemotherapy axial T1 fat-saturated image demonstrating normal-sized pancreatic head with T1 signal isointense to that of the remaining pancreas and absence of a defined mass; (D). Post-chemotherapy coronal T2 fat-saturated image demonstrating decreased common bile duct dilatation. MRCP, magnetic resonance cholangiopancreatography.

ALT Histology of the pancreatic mass. (A) H&E staining showing eosinophilic granules; (B) Negative CD138 immunohistochemical staining, indicating absence of plasma cell infiltrations commonly associated with autoimmune pancreatitis; (C) Positive CD43 staining (brown) raises possibility of atypical lymphoid or myeloid cell involvement; (D) Positive MPO staining (brown), supporting presence of myeloid lineage cells. H&E, hematoxylin and eosin; MPO, myeloperoxidase.

ALT UES average measurements (volume in cc, pressure in mmHg, distensibility index in mm²/mmHg, and diameter in mm) by dysphagia status in patients with PFD. In this box-and-whisker plot, X represents the mean value; dots indicate outliers; the box illustrates the interquartile range; and the horizontal line denotes the median. DI, distensibility index; PFD, pediatric feeding disorder; UES, upper esophageal sphincter.

ALT Parameters trend at baseline and after 12-month therapy with ETI. (A) Sweat chloride test (p < 0.001). (B) BMI z score (p < 0.001) (t test). BMI, body mass index; CI, confidence interval; ETI, Elexacaftor/Tezacaftor/Ivacaftor; M, months.