

FireCharts, Crypto Market Data & Trading Signals. CMC Contributor https://xitter.cf/t.co/XPDgQhMjZX Join our FREE Trading Community on Telegram https://xitter.cf/t.co/YMUzV9FRcI
USA
Joined February 2020
- Tweets16.2K
- Following2.8K
- Followers32K
- Likes7.2K
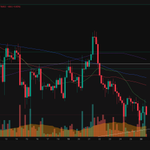


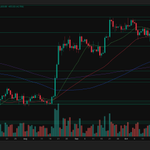
Stealth accumulation, or a trap below resistance?
FireCharts’ smallest cohort (orange) drove $33M of $36M in net bitcoin:native flow over 24H while TWAPing long.
That ain't retail, but so far it hasn't been enough to reclaim the 50-Day SMA.
Wait for closes, liquidity and order flow from larger cohorts to validate directional momentum.

When you look at the data beneath the candles, and analyze order book and order flow dynamics, you can see these traps getting set, and rn it looks like another one is being baited.


This is one of the nastiest traps I've ever seen for bitcoin:native.
Here's what I'm watching in the aftermath. youtu.be/q6vYbeVTqs8?si=4syq…

It looks like the smallest order class in the binned CVD (orange) turned on the TWAP bot again.
There's a new block of ask liquidity at $82.5k trying lure in shorts. I expect it to move or get pulled rather than sit there waiting to get filled.
Happy Friday - Weekend Whale Games have begun.

I’VE WATCHED BITCOIN SINCE 2017 - I’VE NEVER SEEN THIS xitter.cf/i/broadcasts/1DxLdZlkv…
I've been studying BTC intently since 2017, and I can't recall a time where I saw liquidity and orderflow dynamics choreographed as well, or as blatantly as this.
Wednesday we saw what appeared to be an epic battle in the Bitcoin order book, and the market watched to see if it would lead to a durable breakout.
The day began with a buy wall of BTC price approaching the Q4 Open at $83.5k and a buy wall appearing at $83k, push price higher, squeeze shorts, and bait late buyers into a bull trap.
But shortly after that buy wall appeared at $83k and price began to move up, large blocks of ask liquidity started stacking above $84k with secondary resistance laddered up to $85,250. Price then ate through resistance at $84k before support replenished at that level, corralling active traders into a very narrow range - at that point the bull trap was baited and set. After spending roughly 7 hours trading in an elevated range and luring more traders into longs, price rejected from $85k and a selloff began that unwound a week’s worth of market buying and retraced the entire move. The cascade that followed invalidated the attempt and liquidated over $500M in late longs.
Now price is fighting for support at the 50-Day SMA for the 9th time in a 2 week period. Before you react and get caught in the next directional trap, remind yourself that wicks don’t count - confirmation comes after closes.
If you missed a short from the top of the range, this isn’t the place to chase one, because price is flirting with a technical support/resistance flip at the 50-Day SMA, and it certainly isn’t the place to open a long - for the exact same reason.
BTC price can develop 3 different ways from here:
Find support before a CHoCH at the LL, close above the 50-Day SMA, then aim for a retest of resistance in the range between the 21-Day SMA and the Q4 Open
Lose support at the LL, validate a CHoCH from HH/HL and extend the downtrend
Chop in the range above the adjacent low and below the adjacent high - high risk

"Things that make you go, Hmmm..."
Battle lines have been drawn in the bitcoin:native order book with bid liquidity stacked ~$83k attempting to keep price elevated, and ask walls laddered above ~$84.2k suppressing price into a tight range while the smallest order class (orange) uses a TWAP bot to accumulate tens of millions daily.
Over the last 7 days the orange cohort has taken over $150M in ask liquidity and they don’t seem to be slowing down. That’s exponentially more than their average and it accounts for the overwhelming majority of the Net $185M in Net order flow in the last 7 Days on @binance .
There's a good chance we see some shifting liquidity dynamics or spoofing around the TradFi open.
Stay focused and disciplined.

FireCharts binned CVD shows an extraordinary amount of bitcoin:native TWAP bot volume among the 3 smallest cohorts during various blocks of time over the last 24 hours, but ask liquidity kept replenishing and absorbed the volume.

Shenanigans aren't just for the weekends.
FireCharts shows some intentional liquidity herding in the bitcoin:native order book as ask liquidity moved from $90k down to $84k before getting pulled. Now bid liquidity is strengthening at $80k.

The smallest cohort (orange) on FireCharts Binned CVD continues to TWAP.
If you think that’s retail getting rekt, it’s not. This isn’t a sneaky whale trying to hide intentions - this is a tactical move in a thin order book likely executed by an institutional TWAP bot.
By switching the live FireCharts to Absolute CVD we can see that Orange has purchased ~$12M worth of BTC in $100 - $1000 sized orders over the last 12 hours while managing to keep price in a < 1.5% range. The larger order classes could not deploy that same volume in larger orders without pumping price higher.
Learn how to get a better understanding of what’s happening beneath the candles here. mi1.pw/xmi

Some wild price action today. Even though it seems like $BTC volatility has settled down, that may be temporary...
Order Flow remains decidedly bearish.

After a volatile morning (Eastern Time) bitcoin:native price has stablized, but don't allow yourself to gain a false sense of security.
After a flush below $80k, reclaiming the 50-Day SMA is indeed bullish for bitcoin:native, however the fact that price made a Lower Low, and the relief rally was met with a hard rejection from the Timescape R/S Flip Line at $82.5k increases the probability that we'll see another support test before a clean break above the Yearly Open at $87.5k - If price can flip the Quarterly Open at $83.5k, I'll reevaluate.


UPTOBER FAIL - WHEN WILL BITCOIN PRICE RECOVER? xitter.cf/i/broadcasts/1YGNrbgNe…

Will good news = bad news?
Core Inflation data release coming in < 10 minutes.
Here's how the bitcoin:native order book on @binance is set up before the data release.
The volatility has begun.


Facts:
Testing and retested support at the 50-Day SMA is extremely bullish for bitcoin:native, however...
Rejections from 3 consecutive daily resistance tests at the 21-Day SMA indicate that bulls don't yet have the momentum to breakout, and...
Another rejection from the Q4 Timescape R/S Flip Line at $83.5k validates the fading bullish momentum.
Conclusion: Until BTC can start printing full candles above both Q4 Timescape Levels at $83.5k and $86.5k there is a chance for a deeper support test down to the $69k - $75k range.

MTF Mean Reversion for the W.
The key is knowing the ATR of the assets you're trading and setting your deviations relative to that range.
Learn more about mean reversion. mi1.pw/xmtf


UPTOBER FAIL - CRYPTO'S BIGGEST SUPPORT TEST IS HERE xitter.cf/i/broadcasts/1AGRnZrNP…
With Bitcoin price eroding away the hopes, dreams, and portfolios of the Uptoberists, now we need to focus our attention on how BTC, ETH, and ALT prices are likely to develop from here. In today’s crypto market analysis we’ll look at the structure, liquidity, and order flow on BTC, ETH, and SOL to gain some insight on how various scenarios may play out.
Last week I told you about the dynamic relationship between Timescape Levels and warned you about buying into the Uptober narrative - now you know why.
A rejection from the first weekly open of Q4 forced price into a support test at the Q4 Open. Today that test failed and now assets are searching for support.
Things to Watch
• BTC, ETH, SOL and many other Altcoins have lost their daily trend and the Q4 Timescape Levels, and are now searching for support in their respective prior consolidation ranges.
• The 50-Week SMA is widely believed to be a macro R/S flip line for Bear/Bull markets. Holding it would be an extremely bullish support test. Losing it would likely trigger a cascade to the next range lower.
• If BTC price breaks below the 50-Week SMA and goes to $71.3k, we can’t rule out the possibility of testing $69k - IMO, it’s the most important structural level on the chart.
• ETH is rapidly approaching a support test at the 50-Week SMA
📊 Trade the charts. Ignore the noise.
⚠️ Opinions only. Not financial advice.
🔔 Like, subscribe, and turn on notifications so you don’t miss future BTC market updates.

Watch out for a lower low?
• bitcoin:native is now testing support at the prior range high which has confluence with the Timescape R/S Flip Line at ~$82.5k - currently serving as support
• Today's D candle is still a higher low, but there’s a lot of time left for that to change
• Psychological support at $80k has confluence with the 50-Day SMA
• Structural Support at the Timescape R/S Flip Line at $78,380 has confluence with technical support at the 50-Week SMA and the macro trend line
• The 50-Week SMA is widely believed to be a macro R/S flip line - losing it would likely trigger a cascade to the next range lower where the 21-Week SMA has confluence with the Timescape R/S Flip Line at $71.3k
• If price breaks below the 50-Week SMA and goes to $71.3k, we can’t rule out the possibility of testing $69k - IMO, it’s he most important structural level on the chart
How low do you think this support test will go?

