

Mapping the world with Python. Buy my book here - https://teapaw.org/t.co/hAaaAxtIO9
Planet Earth
Joined January 2021
- Tweets2.3K
- Following527
- Followers77.4K
- Likes8.1K




Day 1 of the #30DayMapChallenge - Points.
Meteorite landings from the NASA Open Data Portal.
The points cluster heavily where people live and search. Either rocks fall on cities, or we only find them when we look.
How much of the challenge will I complete?
#Python #DataVisualization

Trying my hand at infographics. Mapping maritime choke points. Unfortunately the publicly available data used to produce this was recorded between 2015 and 2021 - Prior to the Houthis actions in the Red Sea and the war in Iran, which no doubt change this picture.

Forest Loss. This map shows forest loss since 2000 in Africa. Defined as a stand-replacement disturbance, or a change from a forest to non-forest state.

Forest Loss. This map shows forest loss since 2000 in South America. Defined as a stand-replacement disturbance, or a change from a forest to non-forest state.

Forest Loss. This map shows forest loss since 2000 in Asia. Defined as a stand-replacement disturbance, or a change from a forest to non-forest state.
For those who care - projection is EPSG:27703 is WGS 84 / Equi7 Asia

Forest Loss. This map shows forest loss since 2000 in Oceania. Defined as a stand-replacement disturbance, or a change from a forest to non-forest state.

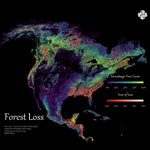
Forest Loss. This map shows forest loss since 2000 in North America. Defined as a stand-replacement disturbance, or a change from a forest to non-forest state.

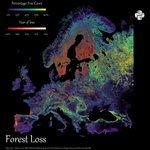
Forest Loss. This map shows forest loss since 2000 in Europe. Defined as a stand-replacement disturbance, or a change from a forest to non-forest state.

This bivariate map uses WRI's Aqueduct 4.0 data to show projected gross water demand (white→orange) vs. blue water availability (blue→purple) under a business-as-usual scenario by 2065–2095.

This bivariate map uses WRI's Aqueduct 4.0 data to show projected gross water demand (white→orange) vs. blue water availability (blue→purple) under a business-as-usual scenario by 2065–2095.

This bivariate map uses WRI's Aqueduct 4.0 data to show projected gross water demand (white→orange) vs. blue water availability (blue→purple) under a business-as-usual scenario by 2065–2095.

This bivariate map uses WRI's Aqueduct 4.0 data to show projected gross water demand (white→orange) vs. blue water availability (blue→purple) under a business-as-usual scenario by 2065–2095.

This bivariate map uses WRI's Aqueduct 4.0 data to show projected gross water demand (white→orange) vs. blue water availability (blue→purple) under a business-as-usual scenario by 2065–2095.
For those who care - projection is EPSG:27703 is WGS 84 / Equi7 Asia

This bivariate map uses WRI's Aqueduct 4.0 data to show projected gross water demand (white→orange) vs. blue water availability (blue→purple) under a business-as-usual scenario by 2065–2095.
Inspiration came from this post from @Esri - esri.com/arcgis-blog/product…


