




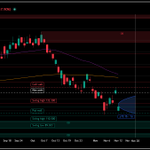


ALT Saturday Setup card, as of Nov 06 close. Tiles: average 7 day expected move 6.9%, average 30 day expected move 12.2%, 14 of 14 names show calls cheap. Table lists ticker, spot, 7 day expected move, 30 day expected move, 30 day risk reversal and cheap side: $SPY 735.29, 3.1%, 5.5%, 8.2, calls. $QQQ 656.10, 4.7%, 8.1%, 10.1, calls. $IWM 273.64, 3.3%, 6.2%, 6.5, calls. $SMH 463.96, 8.5%, 14.5%, 13.9, calls. $MSFT 530.61, 4.4%, 8.2%, 6.1, calls. $NVDA 186.64, 8.2%, 15.7%, 14.1, calls. $AMZN 259.30, 5.3%, 9.5%, 5.4, calls. $META 610.15, 6.3%, 11.5%, 5.5, calls. $GOOGL 284.78, 5.2%, 9.3%, 3.9, calls. $TSLA 358.22, 8.0%, 14.1%, 10.1, calls. $AMD 449.04, 11.9%, 19.1%, 10.2, calls. $MU 690.00, 12.9%, 21.1%, 16.1, calls. $HOOD 80.91, 9.8%, 18.5%, 8.6, calls. $UBER 68.59, 5.1%, 9.6%, 2.6, calls.

ALT Saturday Setup follower picks, as of Nov 06 close. Tiles: average 7 day expected move 7.4%, average 30 day expected move 13.8%, 3 of 5 names show calls cheap. Table lists ticker, spot, 7 day expected move, 30 day expected move, 30 day risk reversal and cheap side: $DIA 512.22, 2.9%, 5.0%, 5.6, calls. $GLD 372.58, 3.3%, 6.3%, 1.6, calls. $APLD 15.55, 16.7%, 29.8%, 13.1, calls. $USO 148.41, 7.1%, 14.6%, negative 6.6, puts. $GME 25.12, 6.8%, 13.3%, negative 3.7, puts. $DRAM is not shown.


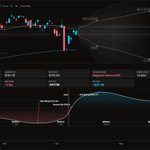
ALT Smile Shape Compass, live Nov 12, 2026, 12:08 PM ET, 1 month options expiring Dec 11, 2026 (29 days). Scatter of 18 names: x axis is 25 delta call IV divided by ATM IV, y axis is 25 delta put IV divided by ATM IV, with dashed guide lines at 1.00 splitting the chart into put skew (top left), smile (top right), call skew (bottom right) and ATM peak (bottom left). Tiles read put skew 16 of 18, smile 1 of 18, call skew 0 of 18, on axis 1 of 18. SPX sits highest and furthest left at 0.85 call and 1.24 put. QQQ, IWM, DIA and MSFT follow up the put wing, with SMH, AAPL, TSLA, BRK.B, IBIT, GLD, AMZN, MU and NVDA clustered near 0.94 to 0.99 call and 1.03 to 1.09 put. META and AVGO overlap near 0.99 and 1.02 and share one label. GOOGL is gray, on the 1.00 call line. XLF is the only name in the smile quadrant.


ALT Card: share of daily closes where the front month $VIX future settled above the next month, from Jan 2 2024 to Nov 11 2026 across 719 sessions, grouped by spot $VIX at the close. Under 15: 0% of 183 days. 15 to 20: 8% of 407 days. 20 to 25: 65% of 89 days. 25 to 30: 96% of 25 days. 30 and up: 100% of 15 days. Tiles: 18% of all sessions, 19 stretches, median stretch 2 days, longest 35 days. Table of the last five sessions with Nov future, Dec future and spot $VIX: Thu Nov 5 24.54, 22.19, 28.18. Fri Nov 6 23.69, 22.18, 25.64. Mon Nov 9 20.01, 19.49, 19.92. Tue Nov 10 19.91, 19.51, 19.46. Wed Nov 11 18.05, 18.40, 17.49, the only one with Nov below Dec.

ALT Card: forward value of $VIX implied by $VIX options at each expiry, from Tuesday Nov 10 closing trades, using call price less put price plus strike, median over strikes 17 to 22. Monthly options: Nov 18 at 19.83 from 11 strike pairs and Dec 16 at 19.54 from 10 pairs. Weekly options: Nov 24 at 19.85 from 6 pairs and Dec 1 at 19.86 from 5 pairs; Dec 9 had only 2 traded pairs and is left blank. Reference lines show the Nov future close at 19.91 and the Dec future close at 19.51. Tiles repeat Nov future 19.91, Nov 24 weekly 19.85, Dec 1 weekly 19.86 and Dec future 19.51. Table lists expiry, pairs, forward and future for each expiry, plus spot $VIX at 19.46.


ALT $SOX round trip in 4 sessions. PHLX Semiconductor Index daily closes, data since May 1994. Nov 4 close 10,268.65. Nov 5 close 9,011.14, down 12.2%. Nov 11 close 10,564.11, up 2.9% from the Nov 4 close. $SPX down 0.9% from the Nov 4 close to the Nov 11 close. Sessions to get back after the worst days: Mar 16 2020 down 15.9%, 8 sessions. Nov 5 2026 down 12.2%, 4 sessions. Apr 14 2000 down 11.6%, 1 session. @SPXVIX