

Behind the option dealer positioning curtain 🧙♂️ Options, vol, bat flips, dad jokes 🪄 Join us: https://teapaw.org/t.co/RBtTsngLeP 🧙♂️ Disclaimer: https://teapaw.org/t.co/TfWPx8wnhb
United States
Joined November 2017
- Tweets11.2K
- Following184
- Followers11.4K
- Likes4.2K



Pinned Tweet
The Most Accurate Way: The Volland Way
Recently, I issued articles that criticize the cottage industry of the dealer positioning services that use reductive assumptions, including GEX, open/close data, and midpoint analysis.
Someone asked me: if these methods are so wrong, then what is Volland’s method of determining dealer positioning?
Another person asked me: why should I care if my favorite method already works for me?
Both are fair questions.
The options industry has done a lot of work to increase transparency and education. There is a lot of data out there to accomplish many needs. As option volume increased, the data has also increased. Small institutions, non-quant institutions, and retail investors can easily get intimidated by this data, but that’s why Vol.land exists.
Volland’s data and studies are peer-reviewed and relevant, ensuring users have coherent and actionable data. For dealer categorization, this is our process:
/1

December 2026 Option Month Outlook: Is volatility here to stay? Plus, ticker analysis including equity futures
After October opex, the market took a nosedive, dropping -10% between the monthly October and November option expirations.
The drawdown between October 2026 and January 2027 that I mentioned many times in these notes (including November’s option month outlook) looks prophetic at this point. The 7300 target was reached and surpassed on the last day before expiration when the impact of vanna is the lowest.
Continue reading on wizardofops. s u b s t a c k .com

7
1,272
Is bearishness done?
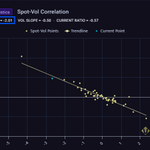
I am reading a lot of commentary saying skew is "steep". It is NOT steep. In fact, it is too flat. The current spot-vol correlation over the past 6 months is implying a skew of 2 $VIX points for every 1% of $SPX movement. The 30-day skew is pricing 1 $VIX point. The Pearson is .88, this isn't a fluky read.
I think we will start chopping soon, but if you are relying on a vol crush rally, it will disappoint. Assuming proper "vixing", the maximum rebound is half of the recent drawdown since October on a swing basis.
The door is open for more downside. It is not yet time to BTD.

I have been seeing this drop for a long time, citing 7000 $SPX as the target. The drawdown started exactly on Oct. opex, had 2 vol events, and finally hit 7000.
The "dealer positioning" you have been following whether it is open/close, GEX, midpoint analysis, or anything else is at best second to our microstructure analysis. If you are serious and data-centric in your trading, #Volland is the only place you will find this level of microstructure analysis. Come to the free discord vollanddiscord.com to get started. Ask questions like how we are different, and what microstructure really moves markets. We will answer.


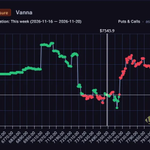
From a vanna standpoint, October is very strong. This is evident across the options space, most specifically in spot-vol correlation. Other than a few outliers, spot-vol correlation over the past 3 months has been very steep, showing an increased sensitivity of option pricing to moves in the underlying. Once October passes, aggregate vanna will spike to the downside, which will open up a trap door to market downside.
In the end, it means there’s a window where equities can see a sharp downside starting Oct. opex week into the end of the year. We are likely to see a vol event sometime in that window.

2
18
3,016
Re-Run: Trader's Workshop | The Brew Ep. 524 teapaw.org/i/broadcasts/2JQemrQOj…

3
1,087
Good Morning! What started in the pre-market as a flash of hope swiftly turned into more downside as SPX lost another -2%.
Yesterday we finally lost 7300 as Nov. opex arrives. If you remember I said that 7300 is a huge support at least until opex. If I were to guess, an OTC transaction or swap hedge (which is common) ushered in a dramatic downside that exceeded 7300 and continued. The ANT IPO seemed to time the 7300 break. We are now close to the target I set in Sep. of 7000.
Is the underlying market showing any stress?
Read more on today's 𝑺 𝒖 𝒃 𝒔 𝒕 𝒂 𝒄 𝒌 post FOR FREE at wizardofops. s u b s t a c k. com

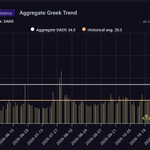
To remind you, DADS stands for Delta-Adjusted Dealer Spread. It is the liquidity measure from Volland that tends to lead IV. While DADS is elevated, it has not hit those stratospheric levels that constitute a vol event. There is currently an active vol event, the one I was telling you we likely wouldn’t reach (and we didn’t, although there is still time), but we aren’t getting the follow through we usually get in times of stress. Many times, that vol event would be followed by many others, but this time it isn’t. While skew is elevated, these drops are not yet being absorbed, and there isn’t a spike down in liquidity. The 7000 target can actually be hit today. We will make the next call when we see the nature of hitting the 7000 strike.
1
4
385
Good Morning! The FOMC Minutes catalyzed a downside thrust, making SPX close -.2%.
Premarket aside, it seemed to mark a bottom as IV started dropping across the whole skew curve despite the SPX drawdown. 7300 was stout as I had mentioned in prior notes and the Market Moves show. The question is now, is this a deadcat bounce or will the vol event target be satisfied?
Read more on today's 𝑺 𝒖 𝒃 𝒔 𝒕 𝒂 𝒄 𝒌 post FOR FREE at wizardofops. s u b s t a c k. com

This is the outlook for Dec. opex.
I still doubt we will satisfy the vol event at this point; it has to pass 7500 before I have any confidence that can happen. I am not playing this upside even though I suspected it would happen yesterday for two reasons. The first is that while I was confident in 7300 holding, this upside appears more like a vol crush dead cat bounce than sustained upside which tends to reverse quickly. The second reason is at this point I want to protect my profits, since this has been a fantastic month so far and the primary thesis played out beautifully. I’d rather wait for the resistance and reassess (again).
413
Trader's Workshop | The Brew Ep. 523 teapaw.org/i/broadcasts/2EmbeneMq…

1
1,162
Good Morning! NVDA led SPX down another -1%.
SPX is down -6.4% off its all-time highs achieved in early October. The drop has been violent at times, but for the most part controlled by expanded IV as mentioned in yesterday’s stack.
We still have an active vol event targeting 7690 by 12/2. Previously we were discussing our doubts that this target will be met. Was there another vol event yesterday?
Read more on today's 𝑺 𝒖 𝒃 𝒔 𝒕 𝒂 𝒄 𝒌 post FOR FREE at wizardofops. s u b s t a c k. com

1
2
1,660
First, there hasn’t been any vol events since the larger scale drop a little over a week ago. This is because spot-vol correlation has gotten very steep, and skew is not yet priced for it. Looking at the overall quad screener, almost every individual stock of note is pinned in low vanna territory. A closer examination reveals little relief. While many are still in positive vanna territory, the amount of hedging is being scaled back, meaning many of these names are being sold, not hedged. I don’t think the selloff is done yet, and I think it will resume after November opex.
1
415
Good Morning! The AI trade continued to unravel as SPX dropped another -1.9%.
The selloff was mostly isolated to tech stocks, which fueled the NVDA-centric narrative. However, this selling should not come as a surprise to regular readers of this morning note. We have been talking about weakness that can culminate in a drop towards 7000 between Oct. and Jan, and it seems that is playing out. I thought it would be a violent drop, but it seems like intermittent vol crushes cause whipsaw. Why is that?
Read more on today's 𝑺 𝒖 𝒃 𝒔 𝒕 𝒂 𝒄 𝒌 post FOR FREE at wizardofops. s u b s t a c k. com

2
4
1,674
This is the SPX spot-vol correlation over the past 3 months, and there are two things to notice. The first is the Pearson coefficient (R2) is extremely high at .88. This is higher than I have ever seen the correlation between VIX and SPX.
The second thing I notice is how high the slope of the line is. The average slope historically is about -1.2. We are looking at -2.05 right now, meaning we can expect a 2-point VIX advance for every -1% drop in SPX. If you look at the 30-day implied skew (1% drop on the 30DTE tenor in SPX), it is implying only a spot-vol correlation of -1. This means liquidity providers are exposed and are making up for it with violent real time skew adjustments. This will reduce the probability of a vol event and will create consistent whipsaw at least down to the 7000 target into Jan.
1
433
Volland's first futures tickers are now available: /ES, /NQ, /RTY, and /YM!
This begins our futures rollout, with more tickers to come.
Available on tiers Universe and Institutional.
The best in class options dealer positioning service just got even better.
vol.land

Nov, 16, 2026 - FUTURES TICKERS DEBUT - Market Moves with Volland: Dealer Positioning & Trade Strategies $SPX $QQQ $ES $Y $RTY $NQ #optionstrading #volatility #liveanalysis #marketdata #optiongreeks #trading #stocks #options #markets @darkmattertrade teapaw.org/i/broadcasts/2WXPoLoVP…

Good Morning! As the NVDA fallout continues, SPX dropped -.4%.
This is not a story that will be going away any time soon, as the US Government has stepped into the fray. This is all leading up to NVDA earnings on Tuesday after market close. The NVDA earnings outlook will be sent tomorrow behind the paywall, as I need to see today and tomorrow’s options flow.
This is opex week, and we still have an active vol event. Will that be satisfied?
Read more on today's 𝑺 𝒖 𝒃 𝒔 𝒕 𝒂 𝒄 𝒌 post FOR FREE at wizardofops. s u b s t a c k. com

Re-Run: Trader's Workshop | The Brew Ep. 522 teapaw.org/i/broadcasts/2ZBjgNmyX…

1,230
Good Morning! After NVDA lost their CEO, SPX dropped -.15%.
SPX had actually recovered from much steeper losses upon the open, as did NVDA. I’m sure we will learn more when NVDA presents earnings next week. The typical move is for NVDA to produce all the bad news in this next earnings call and outperform the presented worst-case scenario in all the earnings after that.
How sustainable is this market recovery?
Read more on today's 𝑺 𝒖 𝒃 𝒔 𝒕 𝒂 𝒄 𝒌 post FOR FREE at wizardofops. s u b s t a c k. com

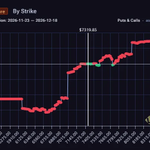
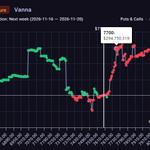
Again, seeing cumulative vanna exposure as a hill, next week’s curve looks slightly bullish, with resistance starting at 7650 and ending at 7700. That will make it tough to reach the 7690 vol event level. It might need a catalyst to get there, such as PPI or NVDA earnings. It will at least get close, however. The deadline is still 3 weeks away on 12/2. There is a chance it can reach after Nov. opex, but I will add to further tenor bearish positions when we reach those levels.
3
526