

cocobolo desk trader.
Error 404
Joined October 2021
- Tweets15.5K
- Following878
- Followers2K
- Likes57.9K
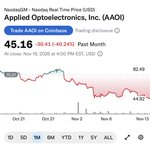
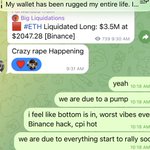





i don’t know why this feels like coordinated FUD. first data centers, then NVDA, then memory, and now AMD. all while the FED is floating rate hikes and we have cyberattack related outages in between. the timing is getting ridiculous.
simulation confirmed
45


gp 🌎 retweeted

BTC:
historically, after we get dumps this big in a straight line w/ zero bounce
the ensuing counter-trend rally is usually at least 15-25% or so
if we got even a tepid-ish one from near here, that'd put us into the low 70's
thing that'll be interesting: do you sell resistance (prob the 200d or 73k or whatever level), or hold thinking "alright 4 year cycle meme time capitulation complete, stocks are in the shitter too, supply shock/inflation over, i think we're out of the woods?"
toughie mcscruffy. let me know what you think in the comments.
- doug


gp 🌎 retweeted

Reporting live from Austin: @strictrope robinhood is COOOOOOKED


gp 🌎 retweeted

I'm still short, but looking for a spot to cover and take profits, possibly sooner than later.
Why?
Because an impending push up is growing likely.
Based on history, the current bull market is long in the tooth; the fifth longest on record. However, since 1950 the S&P 500 has never declined in the year after mid-terms elections. The average S&P 500 gain in pre-election years is 17.2%. What is noteworthy is: most of the gains have come in the first half of pre-election years. The S&P 500 has been flat-to-down in the second half (see chart).
We are heading into a period with multiple bullish tendencies working in the market’s favor. Year-end seasonality is one. The historically strong first half of the Presidential cycle is another (see charts).
If we can get through this period without the Fed moving into a fast tightening cycle, those tailwinds should remain intact. Under that scenario, I would expect the current correction to be relatively short-lived and ultimately give way to a resumption of the broader uptrend.
Could we bottom soon?
There is an interesting historical precedent worth keeping in mind as we approach Thursday's scheduled meeting between the U.S., Russia and China. Going back to some of the most significant meetings between the world's major powers, the stock market was higher following nearly every one of them—sometimes substantially higher.
In 1945, Roosevelt, Churchill and Stalin met at Yalta. Stocks rallied immediately following the meeting and continued higher over the next several weeks.
In 1972, Nixon's historic meeting with Mao in China was also followed by a rising market and new highs in the weeks that followed.
The Reagan-Gorbachev summits show a similar pattern. Following Geneva in November 1985, stocks moved higher.
Reykjavik in October 1986 actually ended without an agreement, yet the market shrugged off the disappointment and gained roughly 5% over the next three weeks.
Following the Washington summit in December 1987, where Reagan and Gorbachev signed the INF Treaty, the market rallied sharply, gaining roughly 7% within a week and continuing higher.
After their Moscow summit in 1988, stocks again rallied strongly, gaining roughly 7% over the next couple of weeks and close to 10% within a month.
Obviously, this is a small sample and every period had a different economic and market backdrop. But the pattern is noteworthy: these major superpower meetings were generally followed by higher stock prices over the ensuing days and weeks.
That matters to us because we're currently short the S&P 500 and sitting on a profitable trade. If the market gives us additional downside going into Thursday, I will likely use that weakness to cover some or potentially all of our short exposure ahead of the meeting.
There's enough historical precedent for a positive reaction that I don't see a reason to overstay a profitable short going into the event.
I have not made the decision to cover my shorts just yet, but a decline from here could be just the opportunity to cover right into weakness at peak equity.
minervini.com


gp 🌎 retweeted

It was not an open-market purchase. Intel Capital had been an investor in Mirantis (a cloud software company). When IREN acquired Mirantis in early August 2026 (closing around Aug. 3–4) by issuing ~12.6 million IREN shares, Intel Capital received roughly 3.59 million of those shares.
gp 🌎 retweeted

I show all this macro stuff on monthly chart because I see us coming out of economic contraction from 2022 through 2025.
We only started coming out of it in early 2026 and started having economic expansion.
It's just been a nasty choppy rotating market for a while, but not everything is crashing at the same time, which still feels like accumulation to me and makes me feel safe holding and buying more with whatever it is that I can afford on the names that I've posted about for a while now.
If you're a trader, that's entirely different. But for a long term horizon standpoint, nothing has really changed for me.
I'm not here to try to change your mind, because this is a major test for you to find out what your risk tolerance is and to act accordingly. No one can advice you what to do.
But I'd hate to see people think that their risk tolerance is high during good times and then flip back to having low risk tolerance during bad times. That is probably the worst thing that one can do, IMHO.


