

Bullish reversal setups with context — not just candlestick patterns. U.S. stock scans, annotated charts, trend/volume/structure filters. Not investment advice.
tomorrow
Joined December 2023
- Tweets3.6K
- Following120
- Followers519
- Likes211


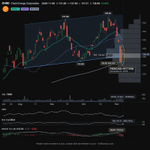
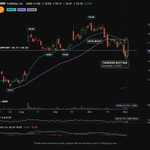


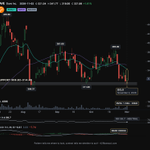
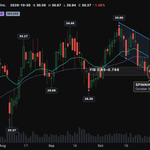
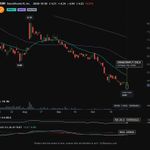
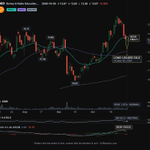
$TRIP | Potential Short Squeeze Setup 🚀
Interesting valuation: Tripadvisor's ~$800M pro forma cash balance is nearly equal to its ~$822M market cap, following a $600M debt repayment. The balance sheet has improved significantly, while the market is still pricing in substantial business challenges.
Why I'm watching $TRIP:
📊 Technical setup
Short float: 37.1%
Days to cover: 12.4
RSI: 36, with bullish divergence
Tweezer Bottom candlestick pattern
31.6% pullback; 55% below its 52-week high
Volume support at HVN
💰 Fundamental highlights
Reduced term loan debt by $600M, leaving approximately $234M.
Approximately $792M in implied cash after TheFork sale proceeds and debt repayment.
Q3 adjusted net income: $43.4M.
Q3 adjusted EBITDA: $71.1M.
Price-to-sales ratio around 0.53×.

125
$CHRD up 7% now

Buy-the-Dip Setup: $CHRD
Another interesting setup to watch.
$CHRD is approaching its trendline support, with the 200-day moving average continuing to rise.
A bullish piercing pattern has formed near trendline support, suggesting buyers may be stepping back in.
The combination of a rising long-term moving average, trendline support, and a bullish reversal candle makes this an interesting setup to monitor.
The goal isn't to catch falling knives. It's to buy weakness within strength.
Confirmation matters: The piercing pattern is an early signal, not a guarantee. Follow-through in the coming sessions will be key.

1
92
🚨 $GT | Potential Short Squeeze Setup?
Goodyear Tire & Rubber is showing some interesting signs worth watching:
📉 Down ~45%
🔥 Short interest: ~25% of float
⏳ Days to cover: 6.8
📊 RSI: 35
📈 Relative volume: 1.08x
🕯️ Doji candlestick printed
📐 Early test of a weekly channel trendline.
The combination of elevated short interest, potential weekly support, and a Doji formation makes $GT an interesting potential reversal candidate.
Could $GT be approaching an inflection point?
Worth keeping on the radar. 🚀
42fibonacci.com/snapshot/GT-…

1
169
$BBWI | Pullback in an Uptrend 📈
Bath & Body Works is showing another interesting pullback-in-uptrend setup.
After a 10.4% pullback from its recent high, the stock is finding support near its 21-day EMA while continuing to trade above its 21-day EMA, 50-day MA, and 200-day MA.
What makes this setup interesting:
Shallow Fibonacci pullback (29.7%).
Trading near the 21-day EMA.
Rising 50-day moving average.
Bullish Harami candlestick pattern.
RSI at 56, indicating neutral-to-positive momentum.
Volume support near a High Volume Node (HVN).
The selling pressure appears to be stalling, potentially setting the stage for a continuation of the broader uptrend.
42fibonacci.com/snapshot/BBW…

1
114
$MTN | Pullback in an Uptrend 📈
Vail Resorts is shaping up as another interesting pullback-in-uptrend candidate.
After a 6.2% pullback from its recent high, the stock is approaching trendline support and its rising 21-day EMA while holding above its 50-day and 200-day moving averages.
What makes this setup interesting:
Pullback toward trendline support.
Trading near the 21-day EMA.
RSI at 53, indicating neutral momentum.
Forming a bullish Homing Pigeon candlestick pattern. Selling pressure appears to be fading, suggesting possible selling exhaustion.
42fibonacci.com/snapshot/MTN…

131
$YETI | Bullish Reversal Setup 📈
YETI is testing a major confluence of daily and weekly horizontal support after a 20.8% pullback.
The stock has formed a Bullish Belt Hold candlestick pattern, accompanied by unusually strong volume (2.41× average).
What makes this setup interesting:
Daily and weekly horizontal support.
Bullish Belt Hold reversal candle.
Strong volume supporting the reversal.
A potential reversal setup worth keeping on the watchlist. 👀
42fibonacci.com/snapshot/YET…

2
112
$LYFT | Pullback in an Uptrend Setup 📈
Lyft is shaping up as a potential pullback-in-uptrend candidate.
After an 11.4% pullback from its recent high, the stock is still holding above its 21-day, 50-day, and 200-day moving averages.
A few technical highlights:
Forming a potential Tweezer Bottom reversal.
Trading near its daily trendline support and rising 21-day EMA.
RSI at 54, indicating neutral momentum.
Short interest stands at 21.5%, with 8.4 days to cover.
The combination of trend support and a potential bullish reversal makes $LYFT one to watch for a possible trend continuation.
42fibonacci.com/snapshot/LYF…

1
166

$DHI D.R. Horton is testing its trendline support and formed a bullish Doji Star reversal pattern.
Adding to the setup, the reversal is occurring on supportive volume near the Point of Control (POC) node — an area of potential support.
42fibonacci.com/snapshot/DHI…

1
112
$ESTY | Another Pullback in an Uptrend Setup 📈
$ESTY has pulled back ~10%, presenting another potential setup identified by our Pullback in an Uptrend strategy.
While the stock has slipped below its daily trendline, it remains well within its broader weekly uptrend channel and is approaching a rising 21-day EMA.
A setup worth keeping on the watchlist as we look for signs of a potential trend resumption.
42fibonacci.com/snapshot/ETS…

$BB up 12% now since the post!
Buy-the-Dip Setup: $BB
One of the better setups to look for in an uptrending market is a pullback into support followed by a bullish reversal signal.
The strategy has three components:
Trend: Price is above a rising 50-day or 200-day moving average, or following an established weekly uptrend channel of at least 20 weeks.
Pullback: Price retraces at least 1 ATR from its recent high, creating an opportunity to enter closer to support.
Reversal: A bullish candlestick pattern forms near support, suggesting buyers may be stepping back in.
Current example: $BB
BlackBerry has printed a bullish harami right at its daily and weekly trendlines.
The idea is simple: trade in the direction of the larger trend, wait for price to pull back to support, then look for evidence that buyers are returning.
The goal isn't to catch falling knives. It's to buy weakness within strength.
Confirmation matters: A bullish candle is a signal to watch, not a guarantee. Follow-through is what makes the setup more convincing.


1
221
$DG is now up 8% since this setup was shared! 📈
This is a classic example of the Pullback in an Uptrend strategy — identifying opportunities when strong stocks pull back within an established uptrend.
Want to find more setups like this? Explore live setups and learn this trading strategy for FREE at 42fibonacci.com/setups/pullb….

$DG — Long-legged doji near the 200-day MA, with a golden cross forming within a long-term weekly uptrend.
Candlestick pattern, technical indicators, and long-term trend all aligning for a potential bullish continuation. 👀


42fibonacci retweeted
$DG — Long-legged doji near the 200-day MA, with a golden cross forming within a long-term weekly uptrend.
Candlestick pattern, technical indicators, and long-term trend all aligning for a potential bullish continuation. 👀
Pullbacks in Uptrends | $LMT
Lockheed Martin ($LMT) has pulled back ~12% from its recent high and is now showing signs of a potential reversal with a Morning Star candlestick pattern.
The stock remains within its 74-week primary uptrend channel and now touches MA200.
42fibonacci.com/snapshot/LMT…

One of the cleanest ways to trade the Long-Legged Doji:
Pair it with MACD.
1. Wait for a real downtrend
2. A Long-Legged Doji prints, lows defended
3. MACD starts turning up
4. Enter on a close above its high
5. Stop below its low
42fibonacci.com/learn/candle…

76
Buy-the-Dip Setup: $CHRD
Another interesting setup to watch.
$CHRD is approaching its trendline support, with the 200-day moving average continuing to rise.
A bullish piercing pattern has formed near trendline support, suggesting buyers may be stepping back in.
The combination of a rising long-term moving average, trendline support, and a bullish reversal candle makes this an interesting setup to monitor.
The goal isn't to catch falling knives. It's to buy weakness within strength.
Confirmation matters: The piercing pattern is an early signal, not a guarantee. Follow-through in the coming sessions will be key.
Check out the chart details below👇
42fibonacci.com/snapshot/CHR…

30
$BB up 7% since we detected this setup!
Buy-the-Dip Setup: $BB
One of the better setups to look for in an uptrending market is a pullback into support followed by a bullish reversal signal.
The strategy has three components:
Trend: Price is above a rising 50-day or 200-day moving average, or following an established weekly uptrend channel of at least 20 weeks.
Pullback: Price retraces at least 1 ATR from its recent high, creating an opportunity to enter closer to support.
Reversal: A bullish candlestick pattern forms near support, suggesting buyers may be stepping back in.
Current example: $BB
BlackBerry has printed a bullish harami right at its daily and weekly trendlines.
The idea is simple: trade in the direction of the larger trend, wait for price to pull back to support, then look for evidence that buyers are returning.
The goal isn't to catch falling knives. It's to buy weakness within strength.
Confirmation matters: A bullish candle is a signal to watch, not a guarantee. Follow-through is what makes the setup more convincing.
5
270
One of the cleanest ways to trade the Dragonfly Doji:
Let its low set your risk.
1. Wait for a real downtrend
2. A Dragonfly prints at support or a major MA
3. Enter on a close above its high
4. Stop below its low
5. Size from that distance
42fibonacci.com/learn/candle…

55
One of the cleanest ways to trade the Long-Legged Doji:
Big range ≠ big signal.
1. Wait for a real downtrend
2. Check its range against ATR
3. Give confirmation a few sessions
4. Enter on a close above its high
5. Stop below its low, and size down
42fibonacci.com/learn/candle…
91