

Chanel: https://xitter.cf/t.co/rVnrggeSBi Business Contact: https://xitter.cf/t.co/lmrKmHHTVy
Twitter
Joined September 2022
- Tweets6.8K
- Following1.2K
- Followers23.1K
- Likes13.3K




Pinned Tweet
📣 #BTCDOM Plan from now until the end of the year:
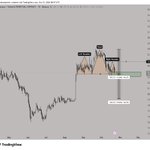
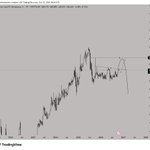
BTCDOM is showing signs of recovering back toward the 63.5% level, which is a liquidity zone that needs to be filled. The confirmation signal is if the weekly (W) candle closes above 60.93% => a high probability that BTCDOM will continue to rise next week.
After completely filling the liquidity zone above, if a bearish reversal signal and lower highs form around this 63.5% region, there is a very high likelihood of a recovery wave for Altcoins.
⚠️ Note:
All shared information represents a personal perspective based on Technical Analysis (TA).
Not financial advice.


🚨#BTC Update
⚫️ As per the previous BTC chart, BTC has broken below the 81.2k support level, so in the short term, the probability of BTC dropping to the 78k–77k zone is quite high.Resistance levels on the H4 timeframe: 80.6 – 81.6 – 83.2.
⚠️ Note:• All shared information represents a personal perspective based on technical analysis (TA).• This is not financial advice.

#BTC PLAN (Oct 20)
Scenario 1: Bullish Scenario
Price consolidates sideways in the $80,600–$81,600 range to build support (SP), continuing the upward move toward $83,000–$83,800.
Scenario 2: Bearish Scenario
If the price fails to hold key support levels (especially the ascending trendline connecting from the $79,726 low and the $80,632 mark), selling pressure will increase significantly.
The price is likely to drop toward the $77,000 region.
⚠️ Note:
All shared information represents a personal perspective based on Technical Analysis (TA).
Not financial or trading advice.

ethereum:native Update 🚨
🔴 The $2,350 – $2,300 support zone is a critical KEY level. If this price range is broken, ETH is very likely to experience a sharp correction.
⚠️ Note:
All information shared reflects a personal perspective based on Technical Analysis (TA).
This is not financial advice.

#ETH Update
🔴MOVE SL Entry

#ETH PLAN
Scenario 1: Recovery from Support
Price holds the current support zone ($2,313–$2,393) and pushes upward to retest the upper resistance area around $2,577.
Scenario 2: Continuation of Downtrend / Deep Liquidity Sweep
If heavy selling pressure completely breaks through the current support zone, the price risks a sharp decline with a target around the $2,095 region.
⚠️ Note:
All shared information represents a personal perspective based on Technical Analysis (TA).
Not financial or trading advice.

#BTC Update ✅
➡️ BTC followed Scenario 1 and tested the 83k–83.4k zone. If this resistance zone is broken, BTC will continue to push toward the 84.7k–85k region.

#BTC PLAN (Oct 20)
Scenario 1: Bullish Scenario
Price consolidates sideways in the $80,600–$81,600 range to build support (SP), continuing the upward move toward $83,000–$83,800.
Scenario 2: Bearish Scenario
If the price fails to hold key support levels (especially the ascending trendline connecting from the $79,726 low and the $80,632 mark), selling pressure will increase significantly.
The price is likely to drop toward the $77,000 region.
⚠️ Note:
All shared information represents a personal perspective based on Technical Analysis (TA).
Not financial or trading advice.
#ETH PLAN
Scenario 1: Recovery from Support
Price holds the current support zone ($2,313–$2,393) and pushes upward to retest the upper resistance area around $2,577.
Scenario 2: Continuation of Downtrend / Deep Liquidity Sweep
If heavy selling pressure completely breaks through the current support zone, the price risks a sharp decline with a target around the $2,095 region.
⚠️ Note:
All shared information represents a personal perspective based on Technical Analysis (TA).
Not financial or trading advice.
#BTC PLAN (Oct 20)
Scenario 1: Bullish Scenario
Price consolidates sideways in the $80,600–$81,600 range to build support (SP), continuing the upward move toward $83,000–$83,800.
Scenario 2: Bearish Scenario
If the price fails to hold key support levels (especially the ascending trendline connecting from the $79,726 low and the $80,632 mark), selling pressure will increase significantly.
The price is likely to drop toward the $77,000 region.
⚠️ Note:
All shared information represents a personal perspective based on Technical Analysis (TA).
Not financial or trading advice.

zcash:native Trading Plan
⚫️Option 1: Short on strong rejection at $1,580 – $1,600.
⚫️Option 2: Wait for a liquidity sweep at $1,640 – $1,660, then short when 4H/D1 closes back below $1,600
🔴SL: Above $1,700
🟢TP: $1,325.00
Plan fails if ZEC breaks $1,692


🔴#BTC CME Chart Analysis
⚫️Pattern: Broadening Wedge / Megaphone Pattern
1. Market Structure & Technical Context
Primary Trend: After a sharp drop from the peak to the low (June–July), BTC consolidated around $60,000 before a strong impulsive move broke the downtrend.
Current Pattern: Price is moving inside a Broadening Wedge (Megaphone Pattern), characterized by expanding volatility with higher highs and lower lows.
Current Position: Price has just printed a strong bullish candle, breaking above the upper boundary of the wedge.
Scenario 1: Bullish Breakout & Re-test
Outlook: Price confirms a breakout above the upper boundary. A re-test of the dashed line at $79,785 (new support) is expected.
Confirmation:
Daily candle closes completely above the wedge boundary.
Strong buying pressure or lower wick rejection appears upon re-testing $79,785.
Scenario 2: Bull Trap / Fakeout
Outlook: Broadening wedges carry a high risk of fakeouts. Without volume confirmation, profit-taking could quickly pull the price back inside the wedge.
Confirmation:
Daily candle closes back below $79,785 with a strong bearish dump.

🔥PLAN #BTC UPDATE
BTC broke out of 77,700 and is retesting the previous high.
Key Bullish Level: 77,500 – 77,700
Scenario 1: Breakout above 82,000 – 82,400
Action: Strong buying pressure pushes a solid 4H candle close above the pink supply zone (82,000 – 82,400).
Price Action (PA): Liquidity cleared, triggering a direct continuation upward. Expect a quick retest around 82,000 (flipping resistance to support) before pushing higher.
Scenario 2: Rejection at 82,000 – 82,400
BTC pulls back to the 79,100 support level.
Case A (79,100 holds): Sell volume exhausts at 79,100. Buyers step back in to build momentum for another attempt to break 82,000 – 83,000.
Case B (79,100 breaks → Retest 77,500):
If 77,500 holds: A bullish recovery structure forms. This offers the best Long entry with an optimal R:R ratio to target the 82,000+ breakout.
If 77,500 breaks: The bullish structure invalidates, confirming the recent rally was a bull trap/retest. Price enters a new downtrend.

bitcoin:native has followed the first scenario, breaking out of the 82,000 – 82,400 zone.
Inside the chart, the prices are Fibonacci levels acting as pivot points.


🔥PLAN #BTC UPDATE
BTC broke out of 77,700 and is retesting the previous high.
Key Bullish Level: 77,500 – 77,700
Scenario 1: Breakout above 82,000 – 82,400
Action: Strong buying pressure pushes a solid 4H candle close above the pink supply zone (82,000 – 82,400).
Price Action (PA): Liquidity cleared, triggering a direct continuation upward. Expect a quick retest around 82,000 (flipping resistance to support) before pushing higher.
Scenario 2: Rejection at 82,000 – 82,400
BTC pulls back to the 79,100 support level.
Case A (79,100 holds): Sell volume exhausts at 79,100. Buyers step back in to build momentum for another attempt to break 82,000 – 83,000.
Case B (79,100 breaks → Retest 77,500):
If 77,500 holds: A bullish recovery structure forms. This offers the best Long entry with an optimal R:R ratio to target the 82,000+ breakout.
If 77,500 breaks: The bullish structure invalidates, confirming the recent rally was a bull trap/retest. Price enters a new downtrend.


🟢If BTC breaks above 82,400 in the next few days and completes a double bottom pattern, it will likely retest the weekly resistance around 90,000 – 92,000.
