

Sports intelligence on demand. Decision metrics, predictive models, and conversational analysis covering the NFL, NBA, and MLB.
Joined July 2026
- Tweets119
- Following123
- Followers32
- Likes70
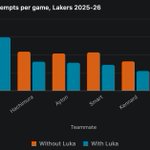




On their shots, yes. On their efficiency, no. All 15 Lakers teammates shot less and scored less with Luka; Austin Reaves fell from 28.6 points to 22.0. But true shooting split evenly, and the team scored more with him.
The Lakers scored 116.9 a game with Luka and 114.4 without. Reaves still had a 63.1% true shooting rate on 14.6 shots a game beside him: fewer touches, not worse ones.

Every regular's shots and efficiency with and without Luka.
databaller.com/s/lakers-team…

Cade Smith got five outs to finish Game 5. How much can Cleveland keep leaning on him in a seven-game series?
Most games, one inning at a time. He's pitched in all five against the White Sox, and Games 3 to 5 took 77 pitches in four days. His heaviest regular-season stretch was 60. Back-to-backs are fine; five-out saves aren't.
He had a 0.66 ERA on back-to-back days this season. Game 4 is the soft spot: 31 pitches the day after two innings, and his only earned run of the postseason.

His game-by-game pitch counts, and who else in the bullpen can carry innings.
databaller.com/s/cade-smith-…

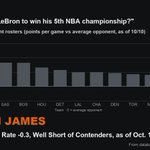
"How likely is LeBron to win his 5th NBA championship?"
A long shot. DataBaller's Power Rating puts his 76ers at -0.3 points per game against an average opponent. Six East teams rate higher, led by Cleveland at 8.7, and Oklahoma City sits at 13.2. Philadelphia isn't a contender.
He's also listed as questionable with chronic left-foot arthritis, and the rating already counts him at about 20 minutes a night. Missed games would pull it lower.

Also in the story: who carries Philadelphia's rating, why last season's 45-37 gives no cushion, and how the team plans to manage LeBron's workload.
databaller.com/s/lebron-s-76…

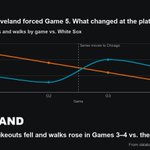
"Down 0–2, Cleveland forced Game 5. What changed at the plate?"
They stopped striking out and started walking. Strikeout rate: 30.4% in Games 1–2, 10.1% in Games 3–4. Walk rate: 11.6% to 19.1%. Patience or wilder White Sox pitching? The numbers can't say yet.
In Games 1–2, long relievers Grant Taylor and Sean Burke had 12 of Cleveland's 21 strikeouts. In Games 3–4, Chicago used seven pitchers a night and walked 17.

Also in the story: game-by-game splits, how Chicago's opener-heavy pitching changed between the two spans, and what Game 5 would tell us about the cause.
databaller.com/s/cleveland-s…

A sports forecast record is worth reading when three things are true: (1) Every forecast was made from what was known before the game. (2) The misses count the same as the hits. (3) It is measured against the betting line, with an honest allowance for luck.
DataBaller's Power Rating is scored that way, every hour. In the NFL so far: our pick won 63.1% of 65 games, the line's pick won 61.5%. Over 65 games luck alone moves a win rate by about 12 points, so that settles nothing yet. The count keeps going. databaller.com/receipts?utm_…

DataBaller v0.8 is live! 🚀 Receipts: every pre-game forecast saved before the start and scored against the closing line, in public, updated hourly. MLB matchups count the starting pitchers. Follow-up questions under every answer. A new model, and a brief that leads with the answer. databaller.com/

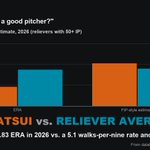
"Is Yuki Matsui a good pitcher?"
Good, but probably not as good as his 1.83 ERA. He walks 5.1 batters per nine against a reliever average of 3.5, and his FIP-style estimate is 4.08, worse than the 3.56 average. The ERA drop came from fewer hits, not more strikeouts.
His strikeouts barely moved over three seasons (69, 61, 68). Hits allowed fell from 53 in 2025 to 37 this year, and his ERA went from 3.98 to 1.83.

Also in the story: how Matsui stacks up against 140 relievers with 50+ innings, his 2024 to 2026 seasons side by side, and what would change the read.
databaller.com/s/yuki-matsui…

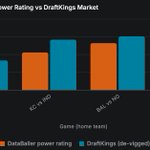
Yamamoto’s top-five case survives without elite strikeout numbers. The Cubs stand apart from teams with the same record. Plus: a closer look at Buffalo and what’s new in DataBaller
"Cubs, Phillies or Padres: who would you least want to face in October?"
The Cubs. All three are 85-69, but Chicago has a +141 run differential, compared with +31 for Philadelphia and +36 for San Diego. The offense makes Chicago the toughest draw on season-long strength.
The Padres have won 9 of 10 against opponents with a .413 winning percentage. October's actual starting-pitcher matchups could still change the picture.

Power Ratings, the Padres' schedule and Philadelphia's rotation health add context to the three-way tie.
databaller.com/s/power-ratin…

"The Bills offense looks unstoppable. Josh in the peak of his powers. Do you agree?"
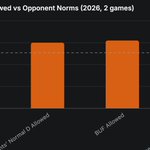
Buffalo is averaging 38.5 points behind Josh Allen's hot start, but a closer look at schedule strength, defensive numbers, and career context shows the 'unstoppable' and 'peak' labels don't hold up after two games.
databaller.com/s/bills-2-0-s…

"What does the Bears' 2025 season say about how strong they really were?"
Good, not 11-6 good. Chicago outscored opponents by 26 points, tied 15th of 32, with the 9th-best offense and 23rd-ranked defense.
The record ran about 1.9 wins ahead of what the scoring margin supports. That gap sits inside the model's normal range, so it isn't a prediction that the Bears will fall back in 2026.

The 2025 scoring ranks, the record-versus-margin comparison, and the limits of the preseason Power Rating.
databaller.com/s/bears-11-6-…
