

I buy extended stocks. Posts are not investment advice.
Planet Earth
Joined February 2024
- Tweets3.3K
- Following57
- Followers2.7K
- Likes2.8K




Monday, October 26
Before Open
$VZ — Verizon
$ARLP — Alliance Resource Partners
$BMRC — Bank of Marin
$BOH — Bank of Hawaii
$BFST — Business First Bancshares
$HBT — HBT Financial
$DEA — Easterly Government Properties
$CX — Cemex
$ABOS — Acumen Pharmaceuticals
$LKFN — Lakeland Financial
After Close
$CLS — Celestica
$CDNS — Cadence Design Systems
$RMBS — Rambus
$NUE — Nucor
$AMKR — Amkor Technology
$WELL — Welltower
$WHR — Whirlpool
$HIG — The Hartford
$CINF — Cincinnati Financial
$BRO — Brown & Brown

👇

1/
The #1 skill in trading isn't finding huge winners.
It's avoiding huge drawdowns.
A 50% drawdown requires a 100% gain just to get back to breakeven.
The best traders obsess over defense first.
🧵👇
Big Wave Chartist retweeted
MAE & MFE might be two of the most underrated metrics in a trading journal.
MAE = Maximum Adverse Excursion
(How far a trade moves against you while you’re in it.)
MFE = Maximum Favorable Excursion
(How far a trade moves in your favor while you’re in it.)
Track them in R and they can answer some VERY important questions about your trading.
Here are some examples:
ARE MY STOPS TOO WIDE?
Suppose your stop is -1R.
After 100 trades you discover:
Average MAE of winners: -0.25R
90% of winners never exceed: -0.50R
Yet you’re routinely letting losing trades reach -1R.
Your winners may be telling you they simply don’t need that much room.
⸻
ARE MY STOPS TOO TIGHT?
You discover:
Average MAE of winners: -0.65R
And many of your eventual +4R/+5R winners initially reach -0.70R to -0.80R.
A -0.50R stop might look disciplined…
…but it could systematically kill your future big winners.
⸻
HOW GOOD ARE MY ENTRIES?
Suppose your 5R+ winners have:
Average MAE: -0.18R
While losing trades average:
MAE: -0.85R
That’s powerful information.
Your best trades may be telling you:
“When you’re really right, the trade tends to work almost immediately.”
⸻
AM I SELLING WINNERS TOO EARLY?
Trade reaches:
MFE: +7R
Exit: +2R
You captured only 29% of the favorable move.
If this repeatedly happens across your trades, your problem may not be stock selection.
It may be your exits.
⸻
AM I GIVING BACK TOO MUCH PROFIT?
Trade reaches:
MFE: +6R
Exit: +1.5R
You surrendered 4.5R of open profit.
That’s 75% of the trade’s maximum favorable excursion.
One trade means nothing.
But if your 3R+ winners routinely surrender 50–75% of their MFE before you exit, that’s something worth investigating.
⸻
SHOULD I TAKE PROFITS AT +3R?
Look at every trade that reached +3R.
Maybe you discover:
40% eventually reached +6R
20% reached +10R
30% fell back below +1R
10% became losses
Now you have actual evidence to evaluate whether trimming at +3R makes sense.
⸻
SHOULD I MOVE MY STOP TO BREAKEVEN?
Look at trades after they first reach +2R.
Suppose many eventual +5R winners later pull back to +0.2R before continuing higher.
An automatic breakeven stop could be destroying expectancy.
But if your biggest winners almost never revisit entry after +2R, breakeven protection may cost very little.
⸻
ARE MY PYRAMID ADDS HELPING?
Maybe your initial entries show:
MAE: -0.20R
MFE: +5R
But after your final pyramid add:
MAE: -1.1R
MFE: +0.8R
Interesting.
The problem might not be your original entry or exit.
You may simply be getting most aggressive when the move is already mature.
⸻
WHICH SETUPS ARE ACTUALLY BEST?
Setup A:
Avg MAE: -0.30R
Avg MFE: +5.2R
Setup B:
Avg MAE: -0.75R
Avg MFE: +2.1R
Even if both setups are profitable, Setup A is producing much more favorable movement for considerably less heat.
That may deserve more attention — and potentially more risk.
⸻
HOW MUCH OF MY EDGE AM I ACTUALLY CAPTURING?
Suppose across 100 winning trades:
Average MFE: +5R
Average realized winner: +2R
You’re capturing roughly 40% of the favorable movement your trades produce.
That doesn’t automatically mean you should hold longer.
But it gives you something extremely valuable to investigate.
MAE/MFE turns vague questions like:
“Should I tighten my stops?”
“Should I take profits sooner?”
“Should I let winners run?”
“Should I pyramid differently?”
…into questions your own trading data can answer.
Your P&L tells you WHAT happened.
MAE/MFE can help tell you WHY.


SITUATIONAL AWARENESS:
We ended Friday with $QQQE just above the 30-week MA and below all key MA's. Not a good look at all. MCSI on the other hand continues bifurcated from the index and - although in an uptrend - is curling a little. Will keep an eye on that. Theres undoubtedly pockets of strength, but tough to get positioned with the volatility.
TREND MAP: YELLOW
PORTFOLIO: I opened $GTLB on a pullback to the 8 EMA.
$GTLB (new)


Is Waste Management the new growth leader? LOL 😂
Oh I see the connection….
Cleaning up this crappy market 🤣

INDUSTRY ROTATION — WEEK ENDED OCTOBER 23, 2026
The most useful signal this week isn't the industry with the biggest weekly gain. It's the services groups gaining confirmation across timeframes.
IT services is the only industry in all three Top 10 lists:
1W +7.21% | 1M +14.92% | 3M +18.15%
It enters the monthly list at #2 and quarterly list at #7. That gives it the cleanest timeframe alignment in this snapshot. Individual-stock breadth still needs work before treating the whole group as a buy list.
SERVICES ARE GRADUATING
Consulting: +6.82% 1W / +16.68% 1M.
Waste management: +5.58% / +13.58%.
Specialty business services: +5.19% / +12.44%.
Consulting and waste appeared in last week's weekly list; now they appear monthly at #1 and #4.
Here's the nuance: waste fell from weekly #3 to #6, and its weekly return slowed from +7.09% to +5.58%. Yet its timeframe confirmation improved. A lower weekly rank doesn't automatically mean the rotation is failing.
Insurance brokers are another migration to watch: last week's weekly #2 is now monthly #3, +14.62%. No quarterly confirmation yet.
ENERGY REMAINS A THEME, BUT THE LEADERSHIP MIX IS CHANGING
Integrated: +12.28% 1M / +20.87% 3M.
E&P: +11.66% / +17.80%.
Drilling: +8.79% 1W / +17.05% 3M.
Energy occupies four quarterly Top-10 slots. Drilling adds participation; E&P joins the monthly list.
Refiners still lead quarterly at +35.18%, but they dropped from the monthly Top 10. Established energy strength doesn't mean every subgroup has equally fresh momentum.
Macro-sensitive leadership deserves macro-sensitive risk management. Oil headlines can change the entry and the stop in a hurry.
HEALTHCARE IS ROTATING WITHIN ITSELF
Medical distribution was on all three lists last week. Now it remains only monthly: #2 to #9, +11.67%, with a quarterly Top-10 exit.
Health information moves the other way: quarterly #3 to #2, +34.64%, plus +5.47% weekly. Monthly confirmation is still missing, but the renewed participation challenges last week's fading-leadership interpretation.
Software infrastructure and application also improve their quarterly ranks to #3 and #4. Neither appears weekly or monthly. Strong quarterly positioning isn't enough to declare fresh short-term acceleration.
EARLY RADAR — CONFIRMATION STILL NEEDED
Staffing +13.92% 1W.
Mortgage finance +8.73%.
Residential construction +5.57%.
Staffing has the loudest weekly number and only one displayed timeframe. Investigate earnings concentration, peer participation and whether the move holds before treating it as durable leadership.
The consumer picture is less coherent: lodging, apparel retail, discount stores and apparel manufacturing drop from the monthly Top 10. Department stores remain, but that doesn't validate a broad consumer rotation.
HUNTING GROUND
1. Waste: $RSG $WM $WCN; $CLH as an adjacent comparator.
Best fresh chart-research priority.
Look for controlled pauses and peer confirmation; check earnings timing.
2. IT services: $ACN $CTSH $EPAM.
Best industry timeframe alignment.
Demand stock-level RS, base quality and constructive volume before promoting a candidate.
3. Selective energy: $XOM $CVX $COP $HP $PTEN.
Established theme plus fresh drilling participation. Favor orderly consolidations over headline gaps.
These are research candidates, not verified entry setups. Strongest industry and best current trade are separate decisions.
The message: services are gaining confirmation, energy remains well represented, medical distribution has lost relative leadership, and health information is trying to re-emerge.
Find the strongest stock with the cleanest risk. A leaderboard can't do that last part for us.

Big Wave Chartist retweeted

NAAIM 87.69
I keep hearing how bearish everyone is and how much this market sucks.
Yet people keep buying the dip, buying the dip, and buying the dip.
NAAIM exposure is up 13 points in a week, while COT data shows positioning only slightly unwinding from its most crowded levels over the last five years.
There's a clear disconnect between what people are saying and what they're actually doing.
Everyone is bearish with their words, but bullish with their pocketbooks.

INDUSTRY ROTATION — WEEK ENDED OCTOBER 23, 2026
The most useful signal this week isn't the industry with the biggest weekly gain. It's the services groups gaining confirmation across timeframes.
IT services is the only industry in all three Top 10 lists:
1W +7.21% | 1M +14.92% | 3M +18.15%
It enters the monthly list at #2 and quarterly list at #7. That gives it the cleanest timeframe alignment in this snapshot. Individual-stock breadth still needs work before treating the whole group as a buy list.
SERVICES ARE GRADUATING
Consulting: +6.82% 1W / +16.68% 1M.
Waste management: +5.58% / +13.58%.
Specialty business services: +5.19% / +12.44%.
Consulting and waste appeared in last week's weekly list; now they appear monthly at #1 and #4.
Here's the nuance: waste fell from weekly #3 to #6, and its weekly return slowed from +7.09% to +5.58%. Yet its timeframe confirmation improved. A lower weekly rank doesn't automatically mean the rotation is failing.
Insurance brokers are another migration to watch: last week's weekly #2 is now monthly #3, +14.62%. No quarterly confirmation yet.
ENERGY REMAINS A THEME, BUT THE LEADERSHIP MIX IS CHANGING
Integrated: +12.28% 1M / +20.87% 3M.
E&P: +11.66% / +17.80%.
Drilling: +8.79% 1W / +17.05% 3M.
Energy occupies four quarterly Top-10 slots. Drilling adds participation; E&P joins the monthly list.
Refiners still lead quarterly at +35.18%, but they dropped from the monthly Top 10. Established energy strength doesn't mean every subgroup has equally fresh momentum.
Macro-sensitive leadership deserves macro-sensitive risk management. Oil headlines can change the entry and the stop in a hurry.
HEALTHCARE IS ROTATING WITHIN ITSELF
Medical distribution was on all three lists last week. Now it remains only monthly: #2 to #9, +11.67%, with a quarterly Top-10 exit.
Health information moves the other way: quarterly #3 to #2, +34.64%, plus +5.47% weekly. Monthly confirmation is still missing, but the renewed participation challenges last week's fading-leadership interpretation.
Software infrastructure and application also improve their quarterly ranks to #3 and #4. Neither appears weekly or monthly. Strong quarterly positioning isn't enough to declare fresh short-term acceleration.
EARLY RADAR — CONFIRMATION STILL NEEDED
Staffing +13.92% 1W.
Mortgage finance +8.73%.
Residential construction +5.57%.
Staffing has the loudest weekly number and only one displayed timeframe. Investigate earnings concentration, peer participation and whether the move holds before treating it as durable leadership.
The consumer picture is less coherent: lodging, apparel retail, discount stores and apparel manufacturing drop from the monthly Top 10. Department stores remain, but that doesn't validate a broad consumer rotation.
HUNTING GROUND
1. Waste: $RSG $WM $WCN; $CLH as an adjacent comparator.
Best fresh chart-research priority.
Look for controlled pauses and peer confirmation; check earnings timing.
2. IT services: $ACN $CTSH $EPAM.
Best industry timeframe alignment.
Demand stock-level RS, base quality and constructive volume before promoting a candidate.
3. Selective energy: $XOM $CVX $COP $HP $PTEN.
Established theme plus fresh drilling participation. Favor orderly consolidations over headline gaps.
These are research candidates, not verified entry setups. Strongest industry and best current trade are separate decisions.
The message: services are gaining confirmation, energy remains well represented, medical distribution has lost relative leadership, and health information is trying to re-emerge.
Find the strongest stock with the cleanest risk. A leaderboard can't do that last part for us.
I ended the day with $GTLB.
Entry at the green line on the chart.
89% cash. Hagw ✌️


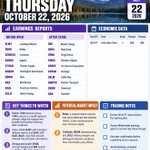
Thursday, October 22 Earnings
Before Open
$LMT — Lockheed Martin
$NOK — Nokia
$CMCSA — Comcast
$ARGX — argenx
$TSCO — Tractor Supply
$HBAN — Huntington Bancshares
$DOW — Dow
$BX — Blackstone
$AAL — American Airlines
$VLO — Valero Energy
After Close
$BE — Bloom Energy
$MXL — MaxLinear
$RNG — RingCentral
$WDC — Western Digital
$SRCE — 1st Source Corporation
$VRSN — VeriSign
$SLM — Sallie Mae
$MRTN — Marten Transport
$NEM — Newmont
$KN — Knowles

SITUATIONAL AWARENESS:
$QQQE reclaimed the 10 MA but found some resistance at the 20-week MA. MCSI is in an uptrend. There's still lots of complacency in the market. A couple days doesn't make a trend and I am still seeing plenty of broken charts at them moment. Nothing to get excited about yet imho.
TREND MAP: YELLOW
PORTFOLIO:
$APA
$SM


Wednesday, October 21 Earnings
**ALL EYES ON THE BIG BOYS AFTER CLOSE**
Before Open
$ABT — Abbott Laboratories
$NEE — NextEra Energy
$T — AT&T
$CME — CME Group
$DHR — Danaher
$LAD — Lithia & Driveway
$TMO — Thermo Fisher Scientific
$PM — Philip Morris International
$NTRS — Northern Trust
$WAB — Wabtec
After Close
$TSLA — Tesla
$META — Meta Platforms
$IBM — IBM
$LRCX — Lam Research
$TXN — Texas Instruments
$TCBI — Texas Capital Bancshares
$CACI — CACI International
$WDFC — WD-40 Company
$MEDP — Medpace
$CCI — Crown Castle

SITUATIONAL AWARENESS:
$QQQE reclaimed a downtrending 5 MA, but still remains below all other key MA's. MCSI is in an uptrend. Until this chop resolves there's nothing for me to do with tech growth stocks. A couple days doesn't make a trend and I am still seeing plenty of broken charts at them moment.
TREND MAP: YELLOW
PORTFOLIO: Per my plan, I focussed on energy stocks today and entered APA and SM on a pullback to their 8 EMA's.
$APA (new)
$SM (new)


SITUATIONAL AWARENESS:
$QQQE is in "no-man's-land" having tested the overhead 5 MA, rejected and still below all key MA's. MCSI is in an uptrend. Until this chop resolves there's nothing for me to do with tech growth stocks.
TREND MAP: YELLOW
PORTFOLIO: Zero trading today and 100% cash.


Tuesday, October 20 Earnings
Before Open
$GE — GE Aerospace
$GM — General Motors
$RTX — RTX
$NOC — Northrop Grumman
$MSCI — MSCI
$MMM — 3M
$VICR — Vicor
$HAL — Halliburton
$HAS — Hasbro
$ALLY — Ally Financial
After Close
$NFLX — Netflix
$SPCX — SpaceX*
$ISRG — Intuitive Surgical
$PEGA — Pegasystems
$NLY — Annaly Capital Management
$UAL — United Airlines
$COF — Capital One Financial
$CB — Chubb
$ALK — Alaska Air Group
$ADC — Agree Realty
