

- Tweets24.6K
- Following344
- Followers7.9K
- Likes6.8K


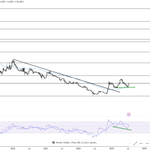
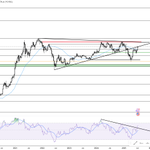


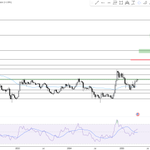
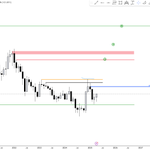







ALT Based on below chart, we can observe a strong historical pattern where price has consistently reacted to the white trendline around past FOMC meetings. Each time (white circles), price has bounced after touching these trendlines, suggesting it acts as a significant support level. Right now, price is once again testing this trendline around another FOMC event, making the upcoming reaction crucial. If history repeats itself, we could see a rebound leading into the next FOMC meeting on March 19. Now, considering potential trajectories: • Option 1: A modest recovery, where price fluctuates near the trendline before gradually climbing towards the pink midline resistance $0.20 • Option 2: A stronger breakout past the midline, potentially reaching $0.61 • Option 3: A parabolic move, where price accelerates past $1.92, targeting the upper channel resistance. Which scenario plays out depends on broader market conditions, investor sentiment, and how the market interprets the FOMC decision.


