






ALT Bar chart titled "New Security Agreements with Pacific Island Countries." It shows various agreements from 2000 to 2026, categorized by type and entity: "Defense Treaty Ally," "Formal Security Agreement/status," "Non-binding Cooperation only" with the U.S., and similar categories for China. The chart highlights a significant event in April 2022 when the China-Solomon Islands agreement was signed. The x-axis represents years, and the y-axis represents the number of agreements. Most agreements occurred between 2010 and 2026. Data source: CSIS.


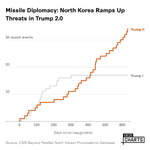
ALT Graph showing the number of missile launch events by North Korea during two periods of U.S. administration. The orange line, labeled "Trump II," indicates more frequent launches, peaking at 46 launches around 600 days. The gray line, labeled "Trump I," shows fewer launches, with a peak of approximately 19. Source: CSIS Beyond Parallel, North Korean Provocations Database.


