

Former USMC & DoS contractor. I build trading systems and write about market regimes and AI infrastructure. My Weekly Market Overview is free every Sunday
Scottsdale, AZ
Joined April 2013
- Tweets35.2K
- Following3.7K
- Followers12.5K
- Likes21.6K




Pinned Tweet
Weekly Market Overview is back
S&P down 2%. Semis down 10%. The average stock finished green
Money didn’t leave the market. It left the crowded trade
What the systems did and what I’m watching this week

A little X growth trend I’ve seen the last 5 days
Post something negative about bitcoin and Temu Jim Cramer aka @jason eill retweet it


First hour market update $SPY
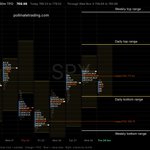
Friday closed $755.72, under the $763.61 to $775.55 range
Roughly 20% of trading days involve a close outside the days range, and Fridays was 1/5... that's normal
First close outside since Oct 22
One close outside is a wobble. Two in a row is a message, so we'll keep our eyes open for another one today
It also closed below October’s value area ($761.50 to $775.50) - notable
Today: $750.07 to $761.80
Through Friday: $742.35 to $769.10
Another close under $750.07 makes it two in a row
Back above $761.50 and Friday was a wobble
It’s the close that matters


Most people think they know what the VIX is, they think it's the "fear index", that ain't it.
Understanding what the VIX is and isn't puts you in an exclusive private club that most people think they are already a part of, but clearly aren't. It isn't as hard as you think...
Think of the VIX as the price of umbrellas. When everyone expects a storm, umbrellas get expensive. After weeks of sunshine, you can barely give them away.
The price tells you what people are willing to pay to stay dry. Whether it actually rains is another question.
The VIX works along those lines. It uses a basket of S&P 500 options, both puts and calls, to calculate how much volatility the market is pricing over the next 30 days. That number is quoted as an annualized percentage.
So what does VIX 20 actually mean?
A couple of shortcuts make it useful:
Divide by 16: roughly 1.25% daily movement.
Divide by 3.5: roughly 5.7% over the next 30 days.
Those are approximate one standard dev moves, in either direction. They’re neither a daily target nor a limit on how far the market can move.
The “fear gauge” nickname comes from how this usually plays out. Stocks sell off, moves get bigger, and people scramble for protection. Put prices rise and the VIX jumps.
During a quiet grind higher, demand for protection often fades. Option sellers keep supplying it, collecting premium and helping push implied volatility lower.
There’s usually a cost to transferring that risk. Options have historically tended to price in more volatility than the market subsequently delivers. Sellers collect a premium for carrying the risk that things get much worse than expected.
Calling that insurance “overpriced” makes selling it sound easier than it is. You’re still responsible when the claim comes in.
A few things are worth understanding before putting money behind a VIX view.
Big spikes tend to fade as the immediate shock passes. But elevated volatility can persist. VIX above 40 doesn’t come with an expiration date.
Known events matter too. CPI, Fed decisions and elections can make options covering those dates more expensive. Once the event passes, that extra premium often comes out. A bad enough surprise can send it higher instead.
And stocks and VIX can rise together. Heavy demand for upside calls is one possible reason. On its own, that combination tells you very little about when a rally will end.
Then there’s the product you actually trade.
You can’t buy the VIX index itself. You can trade VIX futures and options, or funds that hold exposure to those contracts. Those prices reflect expectations about future volatility, so they can behave very differently from the number on your screen.
Many long-VIX funds also continually roll their futures positions. When later contracts cost more than nearer ones, the curve is in contango. If that curve persists, futures can lose value as they approach expiration, creating a drag on returns. Fees and daily leverage resets can make the results worse.
That’s how a reasonable market view becomes a losing trade. The protection was expensive, the move arrived too late, or the product behaved differently than you expected.
Before buying protection, work out how much trouble is already included in the price.
Also beware Black Monday, again

Chris Dover retweeted
I guess the rally’s back on
Thank you Temu Cramer

A brutal year for Bitcoin is just getting started.
Give me three minutes to explain why you should dump it now.
Outflows from ETFs are signal and will continue.
We will test the 57k low again in the next 12 months.
Why?
Because there are far too many dynamic places to put your money that are creating MUCH more value.
Why put your resources into a dead network that offers nothing beyond a store of value?
What's the point of place the BTC be if Bitcoin's Ponzi-scheme nature has gone away!?!
The viral nature of bitcoin was it's power... if you didn't own you were MOCKED!
Now? Completely reasonable, heck, SMARTER, to ignore bitcoin and place other bets!
No one is trying to convince people to buy Bitcoin anymore... the memes and NFTs are gone.
No one is saying $ BTC can change the world, because it won't — and BECAUSE AI HAS!
Just sell and shift from Bitcoin to Super Intelligence because one provides little to no value, and the other provides unlimited upside for humanity.
This should be obvious to everyone right now.
Bitcoin will never break its all-time high again.

PDB first-hour update (Fri Oct 30, 10:30 ET)
$SPY opened under today’s range and spent the whole first hour there
First hour: $757.28 to $761.46
Todays Range: $763.61 to $775.55
Through Nov 5: $755.75 to $782.98
On the way down it filled the old naked POC at $760.75
Intraday prices wander outside the range.
It’s the close that matters
A close under $763.61 today is a wobble. Do it again Monday and it’s a message
Raw numbers: open 761.38
· first hour high 761.46 / low 757.28
· prior close 769.36
· today 763.61 to 775.55
· 5-day 755.75 to 782.98 (low is about $2 under the current price)

Chris Dover retweeted

Good morning. Futures are mixed. Here's what's happening.
Dow futures +0.0%.
S&P futures -1.1%.
Nasdaq futures -2.6%.
Top overnight stories.
1. $INTC plunges 25% premarket
Intel warned it will burn cash this year, citing weak PC demand, manufacturing bottlenecks and heavy spending on new capacity. Its December-quarter revenue forecast also came in below estimates. The market is asking how long the turnaround costs.
2. $AMZN falls 6.5% on cash burn
Amazon posted negative free cash flow for a second straight quarter, and its holiday-quarter sales forecast came in below estimates. The market is weighing AI spending against the payback.
3. Binance hit by a $6.3 billion hack
The world's biggest crypto exchange says about $6.3 billion in assets were stolen, with about $3 billion frozen so far. Withdrawals are paused, and Binance says it will cover all losses. $COIN and $MSTR are down 6% to 7% premarket.
4. Nikkei drops 2.1% as chip stocks slide
Japan's Nikkei fell 2.1% to 63,290, led by chip equipment makers Advantest and Tokyo Electron. $ASML is down about 5% in US premarket trading as the AI spending worry spreads.
What matters today.
The Q3 Employment Cost Index is out at 8:30 a.m. ET, with Chicago PMI at 9:45 a.m. ET.
Stay sharp.

Reminder: This bull market is only 18 months old in SPU’s
In AI stocks it’s a pretty deep bear market already down -30-50% in a lot of names

Chris Dover retweeted

I have been on FinTwit/Twitter/X for 15 years. I am telling you one of the greatest sentiment fades is just listening to the fear/greed extremes from the collective on here. I swear you could tell the highs in eggs, lumber, coffee, etc... over these years. Sentiment extremes all available for free on FinTwit.. 🤑🤑🤑🤑🤑🤑

Chris Dover retweeted

Binance will be "hacked"...
2026 or 2027.
There is no bottom in the market until Binance is hacked.
It's part of the script.
Chris Dover retweeted

Arizona does not participate in rolling the clocks back an hour, BUT… the snowbirds that have arrived will roll their speed limit down to 20 mph.
Technically, it’s like losing an hour of time each direction you drive every day anyway.
SPY market profile read, Thu Oct 29 (as of about 11:25 ET)
Coming in to the day Value had moved higher three days in a row. The daily POC went $765.25, then $769.25, then $771.25.
Wednesday closed $772.31, inside its range and near the top of its value area ($770.00 to $772.50).
The open. SPY opened $768.80, a $3.51 gap down. That’s under Wednesday’s low ($769.24) and under its value area, so the open rejected the last three days of higher value.
The response is what's more important here, sellers didn’t follow through:
The first-hour range is $767.27 to $769.92.
The low held $0.74 above today’s range bottom ($766.53), right around Septembers POC ($767.62).
In the third half hour, price pushed above the first hour high to $770.23. Breaking the first-hour range upward is buying.
Volume over the first two hours was 9.4M shares, a little above the 20-day average of 8.8M. The context in my mind is now FOMC done, PCE done, big earnings out of the way, decisions were made and systematic trend is returning
Where it sits now. $769.98. That’s back inside Wednesday’s range, and on top of October POC ($769.62).
Today’s developing POC is $768.75, with value at $767.50 to $770.00. So far today’s value is lower than Wednesday’s, the first lower day after three higher ones.
The level that matters is $770.00. It’s both Wednesday’s value low and today’s value high.
Accepted above $770: the gap-down was a one-time flush. Next up are Wednesday’s value area, the naked POC at $771.25, and the gap fill at $772.31. A close there leaves the three-day value build intact.
Fails back under the first-hour low ($767.27): the gap stands. Then the target is today’s range bottom at $766.53. A close under it is a wobble, the first outside close since last Thursday. Below that, the next magnets are the naked POC at $760.75 and October’s value low at $762.50.
End of Month --
Tomorrow is October’s last session. Price is sitting on the monthly POC, and everything since Oct 1 is inside October’s value area ($762.50 to $775.00). Whether the month closes above or below $769.62 sets the frame for November’s first days against October’s value.
Model: Bull, low vol, VIX 16.9.
Today’s range is $766.53 to $778.52, and price is in the lower third. Nothing here argues against the model yet.
The gap down tested the range bottom and buyers answered, I'm leaning bullish on the day.

PDB post, Thu Oct 29
Yesterday closed $772.31, inside the $763.90 to $775.85 range for $SPY
That's the 4th close in a row inside the range
On average 1/5 days close outside the range so we are due for a bigger day
Today: $766.53 to $778.52
Through next Wednesday: $758.64 to $785.99
Model still reads bull, low vol.
A close under $766.53 would be a normal event, two in a row is a message
It’s the close that matters

Good morning

Good morning. Futures are lower. Here's what's happening.
Dow futures -0.3%.
S&P futures -0.4%.
Nasdaq futures -1.2%.
Top overnight stories.
1. $GOOGL sinks 11% premarket
Alphabet's search revenue missed estimates, and free cash flow came in at negative $9.1 billion as AI spending jumped. The market is asking when the capex pays back.
2. $MSFT rises as Azure grows 48%
Microsoft's revenue rose 19% to $92.3 billion, and Azure growth sped up to 48%. Shares are up about 1% premarket. The market is rewarding AI spending that already shows up in revenue.
3. $FTNT and $NOW drag software lower
Fortinet is down about 27% premarket despite beating estimates, and ServiceNow is down about 19% after a profit miss. Salesforce, Palo Alto and CrowdStrike are lower too, as AI disruption worries return.
4. $MRVL falls 12% on Lumentum deal talks
Bloomberg reports Marvell is in advanced talks to buy Lumentum $LITE, which has a market value of about $83 billion. A deal could come as soon as next week. Lumentum is up about 5% premarket.
What matters today.
Q3 GDP and September PCE inflation land at 8:30 a.m. ET, and Amazon and Intel report after the close.
Stay sharp.
