

👨💼 Engineering/Finance background 🏝 FI/RE at 34 📬 Sharing my EDGE in the market to 32k+ investors. Join the Edge newsletter for FREE 👇
Joined October 2020
- Tweets17.1K
- Following240
- Followers11K
- Likes18.7K


Pinned Tweet
I spent 2 years building a stock research website. No vibe coding. No AI slop. Just me making something I think is cool.
And I want people to see it but I don't know the first thing about marketing.
If you think it's cool, a like or share would be great:
thestockinvestorsedge.com/da…

CMG Venture Group retweeted

Let’s go $AMD

$AMD | ADVANCED MICRO DEVICES, INC. Q3 2026 EARNINGS HIGHLIGHTS
◆ EPS: $2.09 vs. $1.95 est. ✅
◆ Revenue: $13.38B vs. $13.10B est. ✅
◆ Net Income: $2.43B (+95.3% YoY)
◆ Operating Income: $2.83B (+122.9% YoY)
◆ Operating Expenses: $4.38B (+24.7% YoY)
◆ Operating Cash Flow: $1.20B (-32.8% YoY)
Segment Performance:
◆ Data Center: $8.55B (+97% YoY)
◆ Client & Gaming: $3.72B (-8% YoY)
◆ Embedded: $1.11B (+29% YoY)
Key Metrics:
◆ Free cash flow was $554M in Q3 2026, down from $1.53B in Q3 2025, as capex rose sharply.
◆ Capital expenditures were $648M in Q3 2026, up from $258M in Q3 2025, reflecting infrastructure investment.
◆ A $1.097B non-cash warrant liability fair-value charge reduced GAAP net income; non-GAAP EPS excludes this item.
Forward Guidance:
◆ Q4 2026 revenue: ~$17B, plus or minus 3% (mid-point +66% YoY, +27% sequential).
◆ Q4 2026 non-GAAP gross margin: ~55%.

$BKNG | BOOKING HOLDINGS INC. Q3 2026 EARNINGS HIGHLIGHTS
◆ EPS: $4.66 vs. $4.49 est. ✅
◆ Revenue: $9.79B vs. $9.55B est. ✅
◆ Net Income: $2.72B (-1.1% YoY)
◆ Operating Income: $3.42B (-1.9% YoY)
◆ Operating Expenses: $5.48B (-0.9% YoY)
◆ Adjusted EBITDA: $4.61B (+8.9% YoY)
Segment Performance:
◆ Merchant Revenues: $7.0B (+14.1% YoY)
◆ Agency Revenues: $2.5B (-4.1% YoY)
◆ Advertising & Other: $0.3B (-3.5% YoY)
Key Metrics:
◆ FTC matter reduced Q3 2026 GAAP revenue by $900M and accrued a $100M loss, excluded from adjusted figures.
◆ Free cash flow was $1.07B in Q3 2026, down 22% YoY; up 2% on a year-to-date basis vs. 2025.
◆ Share repurchases totaled $2.1B in Q3 2026; $12.4B remains under the authorized repurchase program.
Forward Guidance:
◆ Q4 2026 room nights growth: +1% to +3% YoY; full-year growth in high single digits.
◆ Q4 2026 gross bookings growth: +2% to +4% YoY; FY 2026 high single digits.
◆ Q4 2026 adjusted revenue growth: 0% to +2% YoY (CC: +2% to +4%); FY 2026 high single digits.
◆ Q4 2026 adjusted EBITDA growth: about flat YoY; FY 2026 high single digits.

$AMD | ADVANCED MICRO DEVICES, INC. Q3 2026 EARNINGS HIGHLIGHTS
◆ EPS: $2.09 vs. $1.95 est. ✅
◆ Revenue: $13.38B vs. $13.10B est. ✅
◆ Net Income: $2.43B (+95.3% YoY)
◆ Operating Income: $2.83B (+122.9% YoY)
◆ Operating Expenses: $4.38B (+24.7% YoY)
◆ Operating Cash Flow: $1.20B (-32.8% YoY)
Segment Performance:
◆ Data Center: $8.55B (+97% YoY)
◆ Client & Gaming: $3.72B (-8% YoY)
◆ Embedded: $1.11B (+29% YoY)
Key Metrics:
◆ Free cash flow was $554M in Q3 2026, down from $1.53B in Q3 2025, as capex rose sharply.
◆ Capital expenditures were $648M in Q3 2026, up from $258M in Q3 2025, reflecting infrastructure investment.
◆ A $1.097B non-cash warrant liability fair-value charge reduced GAAP net income; non-GAAP EPS excludes this item.
Forward Guidance:
◆ Q4 2026 revenue: ~$17B, plus or minus 3% (mid-point +66% YoY, +27% sequential).
◆ Q4 2026 non-GAAP gross margin: ~55%.
$XYZ | BLOCK, INC. Q3 2026 EARNINGS HIGHLIGHTS
◆ EPS: $1.13 vs. $1.03 est. ✅
◆ Revenue: $6.72B vs. $6.58B est. ✅
◆ Net Income: $566M (+22.5% YoY)
◆ Operating Income: $428M (+4.6% YoY)
◆ Operating Expenses: $2.807B (+24.6% YoY)
◆ Free Cash Flow: $972M (-30.6% YoY)
Segment Performance:
◆ Cash App: $2.07B (+27% YoY)
◆ Square: $1.16B (+14% YoY)
Key Metrics:
◆ Adjusted EBITDA reached a record $1.228B in Q3 2026, up from $833M in Q3 2025, a 47% increase.
◆ Cash App reached 60 million monthly transacting actives in September, up 4% YoY, aided by Neighborhoods.
◆ Block ended Q3 with $10.1B total liquidity, including $9.2B in cash, equivalents, restricted cash, and marketable securities.
Forward Guidance:
◆ Q4 2026 gross profit: $3.315B, +15% YoY
◆ Q4 2026 Adjusted Operating Income: $1.005B, 30% margin; Adjusted Diluted EPS: $1.15, +77% YoY
◆ FY 2026 gross profit raised to $12.626B, +22% YoY; Adjusted Operating Income raised to $3.519B, 28% margin
◆ FY 2026 Adjusted Diluted EPS raised to $4.15, +75% YoY

$ANET | ARISTA NETWORKS, INC. Q3 2026 EARNINGS HIGHLIGHTS
◆ EPS: $1.20 vs. $1.08 est. ✅
◆ Revenue: $3.66B vs. $3.33B est. ✅
◆ Net Income: $1,560.4M (+83.0% YoY)
◆ Operating Income: $1,642.4M (+67.9% YoY)
◆ Operating Expenses: $683.3M (+33.5% YoY)
◆ R&D Expense: $486.9M (+49.4% YoY)
Segment Performance:
◆ Product: $3,190.0M (+66.9% YoY)
◆ Service: $467.6M (+17.9% YoY)
Key Metrics:
◆ Q3 2026 revenue grew 58.5% YoY, the highest year-over-year growth rate since Arista's IPO.
◆ Revenue increased 20.5% sequentially from Q2 2026, exceeding company guidance of $3.3B.
◆ H1 2026 operating cash flow was $3,977.4M, up from $3,110.0M in H1 2025, a 27.9% increase.
Forward Guidance:
◆ Q4 2026 revenue guidance: $3.9B to $4.0B.
◆ Q4 2026 non-GAAP operating margin guidance: 48% to 49%.
◆ Q4 2026 non-GAAP diluted net income per share guidance: $1.26 to $1.30.

$DUOL | DUOLINGO, INC. Q3 2026 EARNINGS HIGHLIGHTS
◆ EPS: $0.54 vs. $0.57 est. ❌
◆ Revenue: $0.31B vs. $0.30B est. ✅
◆ Net Income: $27.2M (-90.7% YoY)
◆ Operating Income: $24.2M (-31.2% YoY)
◆ Operating Expenses: $200.9M (+24.2% YoY)
◆ Operating Cash Flow: $89.4M (+6.2% YoY)
Segment Performance:
◆ Subscription: $270.0M (+18% YoY)
◆ Advertising: $20.8M (-1% YoY)
◆ Duolingo English Test: $9.9M (+2% YoY)
◆ In-App Purchases: $6.9M (-38% YoY)
Key Metrics:
◆ Free cash flow was $75.3M in Q3 2026, down 3% from $77.4M in Q3 2025; FCF margin 24.4%.
◆ DAUs accelerated to 29% YoY growth in Q3, up from 23% in Q2, the second consecutive quarter of acceleration.
◆ Duolingo is sunsetting its Max subscription tier; existing Max individual subscribers move to Super family plan.
Forward Guidance:
◆ Q4 2026 bookings: $382M, up 13% YoY; FY 2026 bookings: $1,296M, up 12% YoY.
◆ Q4 2026 revenue: $322M, up 14% YoY; FY 2026 revenue: $1,221M, up 18% YoY.
◆ Q4 2026 Adjusted EBITDA: $84M (26.1% margin); FY 2026 Adjusted EBITDA: $323M (26.5% margin).
◆ Q4 2026 gross margin expected at 72.0%, down 90 bps sequentially as AI-based features expand.

$TOST | TOAST, INC. Q3 2026 EARNINGS HIGHLIGHTS
◆ EPS: $0.29 vs. $0.36 est. ❌
◆ Revenue: $1.98B vs. $1.97B est. ✅
◆ Net Income: $169M (+60.9% YoY)
◆ Operating Income: $165M (+96.4% YoY)
◆ Operating Expenses: $378M (+8.6% YoY)
◆ Operating Cash Flow: $198M (+20.0% YoY)
Segment Performance:
◆ Financial Tech Solutions: $1,619M (+20% YoY)
◆ Subscription Services: $317M (+30% YoY)
◆ Hardware & Prof. Services: $45M (+2% YoY)
Key Metrics:
◆ Free Cash Flow was $181M in Q3 2026, up from $153M in Q3 2025, a 18.3% increase.
◆ Gross Payment Volume grew 20% to $61.8B in Q3 2026 vs. $51.5B in Q3 2025.
◆ ARR grew 24% to $2.503B as of September 30, 2026, vs. $2.016B a year prior.
Forward Guidance:
◆ Q4 2026 Non-GAAP subscription and fintech gross profit: $610M-$620M (22-24% growth vs. Q4 2025).
◆ Q4 2026 Adjusted EBITDA: $200M-$210M.
◆ FY 2026 Non-GAAP subscription and fintech gross profit: $2,375M-$2,385M (26% growth, raised from 23-25%).
◆ FY 2026 Adjusted EBITDA: $840M-$850M (raised from $805M-$825M).

CMG Venture Group retweeted
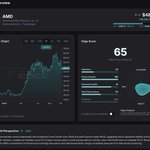
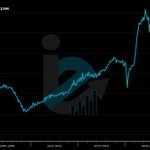
$AMD reports after the bell, can it be one of the few names to actually rise after an earnings report this quarter?
- EPS (est.): $1.94 (+245.8% YoY)
- Revenue (est.): $13.06B (+41.3% YoY)
- Edge Score: 65

$AMD reports after the bell, can it be one of the few names to actually rise after an earnings report this quarter?
- EPS (est.): $1.94 (+245.8% YoY)
- Revenue (est.): $13.06B (+41.3% YoY)
- Edge Score: 65
U.S. job openings came in at 7.523M in September, above estimates of 7.1M.
◆ JOLTs Job Openings: 7.523M vs. 7.100M est. (7.190M prior*)

$SHOP | SHOPIFY INC. Q3 2026 EARNINGS HIGHLIGHTS
◆ EPS: $0.49 vs. $0.46 est. ✅
◆ Revenue: $3.74B vs. $3.70B est. ✅
◆ Net Income: $462M (+75.0% YoY)
◆ Operating Income: $568M (+65.6% YoY)
◆ Operating Expenses: $1,213M (+15.7% YoY)
◆ Operating Cash Flow: $818M (+59.5% YoY)
Segment Performance:
◆ Merchant Solutions: $2.906B (+35% YoY)
◆ Subscription Solutions: $0.836B (+20% YoY)
Key Metrics:
◆ Free cash flow was $816M in Q3 2026, up 61% from $507M in Q3 2025, with a 22% FCF margin.
◆ GMV reached $119.1B in Q3 2026, up 29% from $92.0B in Q3 2025.
◆ MRR grew to $230M at quarter-end, up 19% from $193M in Q3 2025.
Forward Guidance:
◆ Q4 2026 revenue: low-thirties percentage growth YoY
◆ Q4 2026 gross profit dollars: high-twenties percentage growth YoY
◆ Q4 2026 operating expenses: 29% to 30% of revenue
◆ Q4 2026 stock-based compensation: $155 million

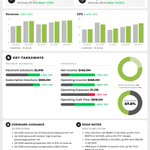
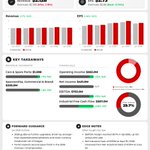
$RACE | FERRARI N.V. Q3 2026 EARNINGS HIGHLIGHTS
◆ EPS: $2.73 vs. $2.66 est. ✅
◆ Revenue: $2.12B vs. $2.15B est. ❌
◆ Operating Income: €563M (+12.0% YoY)
◆ Net Income: €431M
◆ EBITDA: €753M (+12.0% YoY)
◆ Industrial Free Cash Flow: €567M (+43.0% YoY)
Segment Performance:
◆ Cars & Spare Parts: €1,586M (+7% YoY)
◆ Sponsorship, Commercial & Brand: €220M (+4% YoY)
Key Metrics:
◆ EBITDA margin reached 39.7% in Q3 2026, up 12% versus prior year.
◆ Net Industrial Cash of €219M at Sept 30, 2026, improved from Net Industrial Debt of €131M at June 30.
◆ Q3 deliveries totaled 3,368 units; F80 supercar shipments progressed in line with plans.
Forward Guidance:
◆ 2026 guidance further upgraded, driven by stronger-than-expected personalizations and lower currency headwinds net of hedges.
◆ Ferrari expects second place finish in the 2026 Formula 1 Championship.
◆ Higher racing and lifestyle revenues expected for full-year 2026 vs. 2025.
◆ Increased brand investments, racing and digital expenses anticipated for full-year 2026.

$ETN | EATON CORPORATION PLC Q3 2026 EARNINGS HIGHLIGHTS
◆ EPS: $3.68 vs. $3.54 est. ✅
◆ Revenue: $8.95B vs. $8.53B est. ✅
◆ Net Income: $1.08B (+6.7% YoY)
◆ Operating Income: $2.26B (+29.4% YoY)
◆ R&D Expense: $238M (+17.2% YoY)
◆ Operating Cash Flow: $1.31B
Segment Performance:
◆ Electrical Americas: $4.2B (+22% YoY)
◆ Electrical Global: $2.7B (+58% YoY)
◆ Aerospace: $1.2B (+11% YoY)
◆ Mobility: $852M (+10% YoY)
Key Metrics:
◆ Free cash flow was $1.03B in Q3 2026; capital expenditures were $275M in the quarter.
◆ Electrical Global backlog surged 121% YoY, driven by Boyd Thermal acquisition and 27% organic order growth.
◆ Electrical Americas segment margins reached 29.8%, up 230 basis points sequentially to a record.
Forward Guidance:
◆ FY 2026 organic growth: +13% to +15%
◆ FY 2026 segment margins: 24.1% to 24.5%
◆ FY 2026 adjusted EPS: $13.70 to $13.80
◆ Q4 2026 organic growth: +13% to +15%

$AAPL | APPLE INC. Q4 2026 EARNINGS HIGHLIGHTS
◆ EPS: $2.10 vs. $1.99 est. ✅
◆ Revenue: $114.48B vs. $113.40B est. ✅
◆ Net Income: $30.7B (+11.8% YoY)
◆ Operating Income: $35.6B (+9.9% YoY)
◆ Operating Expenses: $19.2B (+20.6% YoY)
◆ R&D Expense: $11.7B (+32.3% YoY)
Segment Performance:
◆ iPhone: $57.6B (+17.5% YoY)
◆ Mac: $10.8B (+23.7% YoY)
◆ iPad: $6.2B (-10.4% YoY)
◆ Services: $31.6B (+9.8% YoY)
Key Metrics:
◆ Gross margin of 47.9% includes approximately 1 percentage point favorable impact from tariff refunds; EPS includes $0.05 tariff refund benefit.
◆ Wearables, Home and Accessories revenue was $8.3B in Q4 2026, down 7.9% YoY from $9.0B in Q4 2025.
◆ Greater China revenue grew 21.0% YoY to $17.5B in Q4 2026, up from $14.5B in Q4 2025.
Forward Guidance:
◆ No guidance provided

$O | REALTY INCOME CORPORATION Q3 2026 EARNINGS HIGHLIGHTS
◆ FFO: $1.12 vs. $1.11 est. ✅
◆ Revenue: $1.62B vs. $1.43B est. ✅
◆ Net Income: $403.9M (+27.9% YoY)
◆ AFFO (Total): $1,061.1M (+7.0% YoY)
◆ Same-Store NOI Growth: 1.1%
◆ Occupancy Rate: 98.8%
Key Metrics:
◆ AFFO per diluted share was $1.12, up 3.7% from $1.08 in Q3 2025, the primary REIT performance metric.
◆ Realty Income invested $2.6 billion in Q3 2026 at a 6.8% initial weighted average cash yield, pro-rata share $2.2B.
◆ KKR partnership launched in Europe: KKR invested EUR 528M for 49% equity in a new 54-property net lease joint venture.
Forward Guidance:
◆ FY2026 AFFO per share raised to $4.45-$4.46 (prior guidance: $4.44-$4.45)
◆ FY2026 net income per share: $1.55-$1.56 (revised from $1.59-$1.60)
◆ FY2026 same store rent growth: 1.1%-1.3% (unchanged)
◆ FY2026 occupancy target: above 98.5%

$PLTR | PALANTIR TECHNOLOGIES INC. Q3 2026 EARNINGS HIGHLIGHTS
◆ EPS: $0.44 vs. $0.41 est. ✅
◆ Revenue: $2.31B vs. $2.18B est. ✅
◆ Net Income: $1.128B (+137.2% YoY)
◆ Operating Income: $1.085B (+175.9% YoY)
◆ Operating Expenses: $845.3M (+45.6% YoY)
◆ Operating Cash Flow: $1.205B (+137.4% YoY)
Segment Performance:
◆ U.S. Commercial: $984M (+148% YoY)
◆ U.S. Government: $953M (+96% YoY)
◆ International Commercial: $961M (+45% YoY)
◆ International Government: $415M (+39% YoY)
Key Metrics:
◆ Adjusted free cash flow was $1.216B in Q3 2026, up from $539.9M in Q3 2025, a 125% increase.
◆ U.S. commercial revenue exceeded U.S. government revenue for the first time in company history.
◆ Rule of 40 score reached 158% in Q3 2026, up from 114% in Q3 2025.
Forward Guidance:
◆ Q4 2026 revenue: $2.649B - $2.653B
◆ Q4 2026 adjusted income from operations: $1.640B - $1.644B
◆ FY 2026 revenue raised to $8.530B - $8.534B, representing ~91% YoY growth
◆ FY 2026 U.S. commercial revenue raised to in excess of $3.559B, at least 143% growth

$BMRN | BIOMARIN PHARMACEUTICAL INC. Q3 2026 EARNINGS HIGHLIGHTS
◆ EPS: $0.23 vs. $-0.08 est. ✅
◆ Revenue: $1.02B vs. $1.02B est. 🟠
◆ Net Income: -$122.8M (+299.5% YoY)
◆ Operating Income: -$82.1M (+75.8% YoY)
◆ Non-Interest Expense: $1,106.7M (+34.5% YoY)
◆ H1 Operating Cash Flow: $577.0M (-20.8% YoY)
Segment Performance:
◆ Metabolic Conditions: $744M (+44% YoY)
◆ VOXZOGO: $245M (+12% YoY)
◆ KUVAN: $23M (-4% YoY)
◆ ROCTAVIAN: $1M (-67% YoY)
Key Metrics:
◆ GALAFOLD contributed $152M and POMBILITI + OPFOLDA contributed $49M in their first full quarter as BioMarin products.
◆ Acquired IPR&D charges of $287.7M in Q3 2026 drove GAAP operating loss; Alesta acquisition was primary driver.
◆ VIMIZIM revenue rose 18% Y/Y to $216M; NAGLAZYME fell 11% Y/Y to $108M due to international order timing.
Forward Guidance:
◆ FY 2026 Total Revenues: $3,800M to $3,900M (midpoint ~20% growth Y/Y), lowered from $3,875M-$3,925M.
◆ FY 2026 Metabolic Conditions Revenue: $2,675M to $2,750M (midpoint ~29% growth Y/Y), lowered from prior range.
◆ FY 2026 VOXZOGO Revenue: $975M to $1,025M (midpoint ~8% growth Y/Y), lowered from $1,000M-$1,050M.
◆ FY 2026 Other Revenues (KUVAN, ROCTAVIAN, royalties): $125M to $150M, raised from $100M-$125M.

The ISM Manufacturing PMI rose to 55.5 in October 2026, above the estimate of 54.6, up from a previous reading of 54.5.
◆ ISM Manufacturing PMI: 55.5 vs. 54.6 est. (54.5 prior*)
◆ ISM New Orders: 55.5 vs. 55.4 est. (55.3 prior*)
◆ ISM Employment: 52.4 vs. 53 est. (52.7 prior*)

$TSEM | TOWER SEMICONDUCTOR LTD. Q3 2026 EARNINGS HIGHLIGHTS
◆ EPS: $1.15 vs. $1.07 est. ✅
◆ Revenue: $0.53B vs. $0.52B est. ✅
◆ Net Income: $120.3M (+124.2% YoY)
◆ Operating Income: $127.1M (+151.4% YoY)
◆ Operating Expenses: $51.6M (+21.6% YoY)
◆ Operating Cash Flow: $185.2M (+32.8% YoY)
Key Metrics:
◆ Q3 2026 capital expenditures (property and equipment, net) were $190.7M, up from $103.5M in Q3 2025.
◆ Free cash flow was negative $5.5M in Q3 2026 ($185.2M operating cash flow minus $190.7M capex).
◆ Adjusted net profit attributable to the company was $131.3M in Q3 2026, up from $62.8M in Q3 2025.
Forward Guidance:
◆ Q4 2026 revenue guidance: $600M, +/-5% range, representing +36% YoY and +14% QoQ growth.
◆ FY 2026 annual revenue expected to reach $2 billion based on Q4 guidance midpoint.
◆ Annualized revenue run rate targeted at $2.4 billion exiting 2026.
◆ SiPho annualized revenue run rate targeted at $1.1 billion in Q4 2026, 5X of 2025 SiPho annual revenue.

$CVX | CHEVRON CORPORATION Q3 2026 EARNINGS HIGHLIGHTS
◆ EPS: $5.28 vs. $4.87 est. ✅
◆ Revenue: $67.80B vs. $61.82B est. ✅
◆ Net Income: $9.9B (+180.4% YoY)
◆ Operating Income: $13.6B (+151.6% YoY)
◆ Operating Expenses: $9.5B (+4.0% YoY)
◆ Operating Cash Flow: $16.0B (+70.6% YoY)
Segment Performance:
◆ U.S. Upstream: $3.3B (-42.1% YoY)
◆ Intl Upstream: $2.4B (-33.1% YoY)
◆ U.S. Downstream: $3.6B (-64.2% YoY)
◆ Intl Downstream: $1.3B (-0.2% YoY)
Key Metrics:
◆ Q3 capex was $4.0B, down from $4.4B a year ago, largely due to lower Permian Basin spend.
◆ Total net oil-equivalent production was 3,980 MBOED in Q3 2026, down from 4,086 MBOED a year ago.
◆ Free cash flow was $12.0B in Q3 2026, up from $4.9B in Q3 2025, a 145% increase year-over-year.
Forward Guidance:
◆ No guidance provided
