

Psychometrics. Hosting professional-grade IQ tests. Transparent and community-trusted. Check out the CORE: https://teapaw.org/t.co/4NitXnFFYW
United States
Joined May 2026
- Tweets401
- Following143
- Followers1.7K
- Likes6.5K




Pinned Tweet
Matrix reasoning tests are overrated and overused.
Here is just one novel test that measures fluid intelligence comparably to Raven's Advanced Progressive Matrices.
Jastrzębski et al. (2023) developed Graph Mapping, a simple computerized test that requires participants to map a pair of corresponding nodes across two relationally isomorphic but visually distinct graphs.
The authors found that Graph Mapping has excellent psychometric properties, with convergent validity and reliability comparable to three prominent fluid reasoning IQ tests (including RAPM). Unique advantages were noted: Graph Mapping has short administration times, is easy to generate items for, and is unfamiliar to participants.
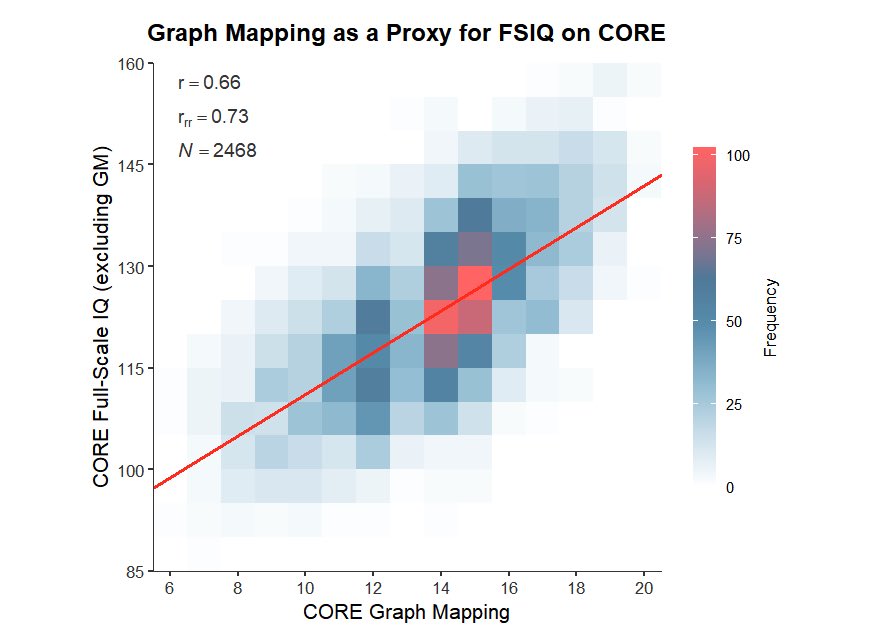
For the Comprehensive Online Reasoning Exam (CORE), we created our own Graph Mapping test. We found that CORE GM has a g-loading of .76 (and FRI load of .78), slightly higher than matrix reasoning (.73) was on CORE!


ADHD is consistently associated with lower intelligence. The difference is larger in children (around 7-10 IQ points), with studies in adults finding smaller differences.
In our own high-ability adult sample, we found that the ADHD group is 5 IQ points lower than the neurotypical group. The most pronounced deficits were in reasoning speed, working memory, and processing speed.
We also found strict measurement invariance between the ADHD and NT sample, indicating that the same construct (mainly g) is being measured just as well between the groups. These results replicate what most studies have found.


We made an adaptive fluid and spatial reasoning test. Items are presented based on your current estimated ability. The test keeps going until your score is measured precisely enough, making it much more efficient than a fixed-length test.
The Abstract Thinking Adaptive Test (ATAT) consists of six item types: figure sequences, figure classification, figure weights, object rotation, pattern completion, and number sequences.
The ATAT was specifically designed to be culture-fair. It should take around 30 minutes in total. Try it out and post your results⬇️


Interesting. Overall intelligence probably peaks in your 30s.
Working memory, perceptual speed, visuospatial reasoning, and fluid reasoning peak relatively early in life. Only crystallized knowledge improves considerably past your 30s.


When people think of "cognitive decline", they typically think of Joe Biden doing a Roomba impression on stage. But cognitive decline begins way earlier than most realise.
Part of the problem, though, is that people can't seem to agree when this happens. Age 20 is probably a bit of an exaggeration (likely a consequence of the study design more than anything else), but it's not far off!
I decided to do a bit of a deep dive trying to answer the question "at what age do we start to get stupider?" 🧵:

Frontier AI models now max out or nearly max out most subtests on our IQ test (CORE), but it’s curious how poorly they still perform on Block Counting.
The difficulty in Block Counting comes from quickly identifying the hidden blocks required for support. AI’s reasoning is fine, so the bottleneck likely lies in how it handles spatial representations.
For instance, AIs might struggle to map a 2D image into an objective 3D coordinate frame, leading to spatial hallucinations.
In humans, CORE Block Counting has a ceiling of 155 IQ, a g-loading of .61, and a total of 31 questions. See the link below to try it out.


The chimpanzees were trained on this task for years. When humans were trained on the task, they matched or outperformed chimps (Cook et al., 2010).
A review concluded that the size of working memory in chimps is 2 ± 1, versus Miller's famous 7 ± 2 in humans (Read et al., 2022).

There is little evidence that humans sacrificed visual short-term memory to acquire language or the phonological loop (known as the cognitive tradeoff hypothesis).
The review proposes almost the opposite: that human cognitive evolution was marked by increases in working memory, enabling the simultaneous representation of more complex relationships and eventually sophisticated stone tools.
"On the working memory of humans and great apes: Strikingly similar or remarkably different?" (2022)
sciencedirect.com/science/ar…
When we factor analyzed the 1926 SAT alongside CORE, a distinct new factor emerged. This factor only appears on speeded tests, hence the tentative name we've given it: Speed.
This factor predominates much of the 1926 SAT, a test with very strict timings. In our broader model, which also includes the GRE and the AGCT, it appears across verbal, quantitative, and spatial tasks.
Here are some of our preliminary findings:
1. Speed is strongly related to general intelligence, with a g-loading of approximately .80.
2. It is clearly distinguishable from CORE’s Processing Speed Index, which uses Character Pairing and Symbol Search (tests of Perceptual Speed, specifically).
3. Its strongest indicators include Logical Inference (.57), Artificial Language (.56), and GRE Analytical (.51). Smaller loadings appear on some CORE subtests: Quantitative Knowledge, Spatial Awareness, Figure Weights, and Graph Mapping. These CORE subtests are all non-leniently timed and are considered slightly speeded by testees.
Overall, Speed's loadings seem too diverse for it to reflect a test-taking strategy or a content-specific ability. We speculate that the Speed factor mostly reflects attentional control and, crucially, the speed at which people process relations.
However, Speed might not reflect particular cognitive mechanisms at all. Most theories cannot be ruled out or confirmed until item response times are analyzed and novel tasks are devised to test competing ideas.


We automated three relational processing tasks that might inform us on Speed: cognitivemetrics.com/benchma…
We have yet to find a particular study that has clearly found what we found.
And looking at the CHC list of cognitive abilities, the closest description of our Speed is rate-of-test-taking (R9), a narrow ability under Gs (definition attached).
However, on more recent lists we did not see R9. It turns out that it was retired by @iqmcgrew and Schneider (2018). Their comments on the matter are attached. It seems like Speed is “Gs-unspecified”, then.
The last sentences continued: "We believe that a significant number of otherwise R9 test classifications in the literature might be classifiable with the two perceptual speed subfactors described above. Much additional work is needed to explicate narrow abilities in the Gs domain." Maybe we’ve stumbled upon something yet to be explicated.


Has there been a general collapse in attention in the past few decades?
A new study compared Austrian adults’ performance on attention tasks in 2025 with matched samples assessed in the early 2000s. It found small, mixed changes instead of a general decline.
Selective attention showed a very slight improvement, but it was not statistically significant. And in a 33-minute vigilance task, contemporary participants responded a bit more slowly, but detected the same number of targets. Their response times also did not deteriorate more rapidly as the session progressed.
Although tests in a controlled setting are different from everyday distractibility, these results undermine the idea that digital technologies have caused sweeping declines in attention. These results also reinforce the domain specificity of the Flynn effect.


An independent user has collected thirty-one CORE–WAIS score pairs, finding a correlation of .797 between CORE and WAIS FSIQ, which rises to 0.811 after correction for indirect range restriction.
The two tests showed strong normative alignment, with the average score differences being insignificant (+1.6 IQ points) and normally distributed.
Although the sample size is small and selected, this further validates CORE's norming methodology and suggests strong convergent validity between CORE and other professional tests.


For context: Comprehensive, high-quality intelligence tests tend to correlate with one another at around r = .80 or more. E.g., the SB5 correlates with other professional intelligence tests at about r = .82 (attached image). This constitutes strong evidence that these tests are measuring the same underlying general intelligence factor. We aim to do a more rigorous comparison between CORE and professional tests in the future.

How quickly one processes simple relations might represent what is often called "reasoning speed".
Try out a test of relational processing speed here: cognitivemetrics.com/benchma…
Its original purpose was to track cognitive changes caused by stressors like sleep deprivation.

