

Bitcoin on-chain research workspace built around verifiable metrics.
Joined March 2026
- Tweets57
- Following13
- Followers897
- Likes23





Pinned Tweet
CoreCharts is a Bitcoin-only on-chain analytics platform.
The goal: make Bitcoin metrics easier to verify, understand, and use in serious research.
Charts, definitions, methodology, and context belong together.
corecharts.com

Whales or small holders: who is driving $BTC accumulation?
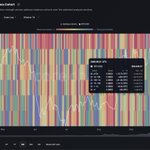
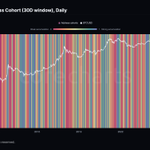
Bitcoin ATS by Address Cohort is now on CoreCharts: a separate 0–1 score for each of six address-balance cohorts, from <1 BTC to ≥10k BTC.

Each cohort is scored against its own history.
Equal scores in the ≥10k BTC and <1 BTC cohorts can reflect very different amounts of BTC.
Hover or tap any day to see each cohort's score alongside its BTC inflows and outflows for the selected window.
The score measures accumulation relative to distribution; the flows show how much BTC actually moved.
Explore the metric on CoreCharts:
corecharts.com/app/metric/bi…

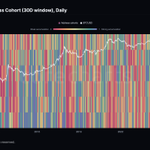
New metric on CoreCharts: Bitcoin Accumulation Trend Score (ATS).
A 0–1 score of aggregate accumulation across six address-balance cohorts.
Track $BTC accumulation strength on 1D, 7D, and 30D windows.

Major Bitcoin events, now on every chart.
Halvings, exchange collapses, ETF launches, protocol upgrades, Fed decisions.
Overlay them on any metric and see how price and on-chain data reacted.


CoreCharts update:
New AVIV metrics are live, including AVIV Ratio, AVIV-NUPL, True Market Mean, Active/Vaulted Supply and Market Cap, and Investor Cap.
corecharts.com/app/metric/av…

Supply Redistribution now uses exact address balance transitions instead of estimating cross-band migration, cutting cohort-reclassification noise.
Triangular weighting within each analysis window puts more emphasis on recent accumulation and distribution.
corecharts.com/app/metric/ad…

New on CoreCharts:
Added Direct navigation. Zoom with the mouse wheel and pan by dragging. The default Ctrl + wheel / Shift + wheel controls remain available. Switch modes in Account settings.
The Bitcoin Price chart now marks historical crossovers: 1D SMA 50/200, 1W EMA 21/50, and 1W SMA 50/100.

When we say CoreCharts works on mobile, we mean it.
Rotate your phone, pinch, drag, inspect.
Bitcoin's on-chain history in your pocket. Literally.
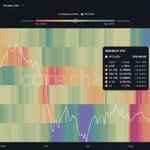
New on CoreCharts: Bitcoin Supply Redistribution Heatmap.
See how BTC supply is redistributed across six address-balance cohorts, from <1 BTC to ≥10k BTC. Identify which cohorts are accumulating or distributing and how significant those flows are relative to each cohort’s own recent history.
Supply-neutral by design: the map shows only redistribution between cohorts — every gain in one cohort is matched by a loss in another, so general growth in tracked BTC supply is excluded.
corecharts.com/app/metric/ad…
🧵 More than a static metric, it is an interactive analysis workflow:


New on CoreCharts: Spent Output Age Bands (SOAB).
Shows the age structure of spent Bitcoin outputs by output count, as stacked share bands with BTC price for context.
Band isolation keeps each cohort in its true stacked position.
corecharts.com/app/metric/sp…
