siu (@CryptoSiu) profile picture

Realtor|Market analyst|Investor|finance talkshowHost| creative director and illustrator for one of the biggest brand in Africa This is my new hobby.

Joined November 2024
Photo by siu (@CryptoSiu)Photo by siu (@CryptoSiu)Photo by siu (@CryptoSiu)Photo by siu (@CryptoSiu)Photo by siu (@CryptoSiu)Photo by siu (@CryptoSiu)Photo by siu (@CryptoSiu)
The time is here!
252
718
41
7,316
473,624
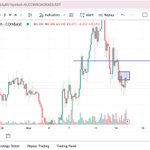
E/acc I think we have to observe whether price will switch to an uptrend on 15minutes chart. This 4hour chart is showing it has reached the extreme demand zone so if change of character happens on the Ltf. We'd look to buy positions. For now either a buy or sell is not certain
17
#XRP JUST BROKE 90 CENT! 📈 I GOT THE FEELING THAT SOMETHING EXTREMELY BIG IS ON THE WAY FOR XRP! 🤯🧨💥
97
283
10
1,931
79,082
Still the King.
542
998
66
8,323
367,516
Let's quickly hop on a buy🤗
8
Im fascinated how BTC affects the markets😂❤️. Quick reminder,When it comes to crypto it takes more than charts analysis e.g S&R , S&D, P&D to make buy or sell trades . Inclusion of fundamental analysis is one of the major keys💡
12
Price didn't reached the extreme supply zone on the 4 hour chart. If it eventually does, we'd still have to confirm if we'd still sell from the 15min market.
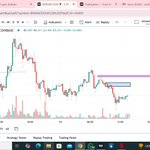
ICP Sell analysis for ICP Price has switch to a downtrend and it has been confirmed on the 4hour. second image is the 15minutes chart, lets see how price reacts from either areas highligted with a rectangle. I would sell. if price closes above, #void
10
This is actually INSANE!! BULLISH
36
11
115
6,093
ICP Sell analysis for ICP Price has switch to a downtrend and it has been confirmed on the 4hour. second image is the 15minutes chart, lets see how price reacts from either areas highligted with a rectangle. I would sell. if price closes above, #void
1
23
Market sold further. 4hour support is still being tested. Not sure how to proceed.
wldusdt [as seen on cryptobubble] WLD signifies a buy . above chart is actually 15 mins and its showing the order flow and in the recent price movement, i foresee it may continue to rise from 2.319
6
From 5.021 to 4.695 . Current price at 4.897. let's see if it falls lower
Replying to @CryptoSiu
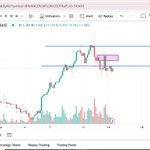
two rectangles in the 15min chart will be a major determinant of either sell or buy. if price fails to close above them, then its likely to go lower and then close below our support on the 4 hr timeframe. If it closes above , may decide to buy after a retest
5
Challenging Siu everyday to be a great analyst some day
5
#XRP CONFIRMED TO BE $327,000 ON THE PRIVATE LEDGER!!
141
407
23
2,236
149,553
$88,201.25
188
171
10
1,476
161,037
$100,000 Bitcoin is programmed.
136
125
3
1,149
64,934
Inflation is impacting the world like never before. 🌍 Prices for everyday goods and services are rising, which means your money buys less over time. Here's how to stay ahead and protect your wealth. 👇
1
1
1
60
maybe wrong, may be right
9
Yesterday i made a buy analysis for Polka dot. today with the current price movement , no candle has closed below the support yet, so there no definite sell movement ....until price closes below the blue line.
1
10
two rectangles in the 15min chart will be a major determinant of either sell or buy. if price fails to close above them, then its likely to go lower and then close below our support on the 4 hr timeframe. If it closes above , may decide to buy after a retest
1
13