

Long term Investor | Technical Analyst - HTF | Crypto | Gold | SPX 💹 Premium Telegram - ↯
In the Lost Lands
Joined July 2017
- Tweets16.7K
- Following11
- Followers8.5K
- Likes23.6K





Pinned Tweet
GOOGL, SPX, etc… This time for $BTC (continuation).


$BTCUSD Expanding Triangle continuation pattern: I’ve been talking about this continuation pattern since February. Nothing significant has happened to invalidate the pattern since then.
I’ve seen similar continuation structures play out with SPX, GOOGL, and several others on LTF. There’s no reason to assume BTC can’t produce a similar continuation.
For now, the suppression (sideways PA) continues at the '21 highs following the backtest. However, it’s only logical that Bitcoin continues higher from there.


Or maybe I should say, "One of the possible paths to get there." But I believe this is the more likely scenario… Due for some bounce around into 2027. $GOOGL


Doomers believe they were right all along, despite doom posting throughout 2026 and watching it rally from 6,300 in March all the way to 7,900 in October. SMH… #SPX
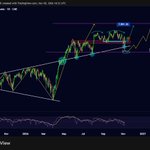
#SPX decided to fully resolve the M-top pattern instead… Almost at the measured move target now.

2 paths I’m currently looking at on #SPX, as I still don’t see a 2008-style crash happening here yet.
Currently, it’s sitting on the upper regression trendline of the Expanding Triangle continuation pattern, which has acted as support on multiple backtests. It could do so again here, or we see the full resolution of the M-top pattern towards 7,300ish before reversing.


𝐃𝐚𝐯𝐢𝐝𝐎𝐧𝐂𝐫𝐲𝐩𝐭𝐨 📘 retweeted
#Bitcoin: $78K support backtest, and it’s time to push towards $94K.
As I’ve been saying, we’re already in the continuation phase, so be more bullish…. My expectation is a flip of $94K when we get there, followed by a straight shot back to ATHs.

And #Bitcoin is now turning that $78K resistance into support on the weekly TF.
Note how bullish confirmation came for most people in the mid-$80Ks, and how they were starting to flip bullish? Now, as we backtest the $78K support, they’ve become bearish again.
The irony is hard to miss.

𝐃𝐚𝐯𝐢𝐝𝐎𝐧𝐂𝐫𝐲𝐩𝐭𝐨 📘 retweeted
$ETH: Exactly the same megaphone structure from June 2025 that helped send it straight back to the 2021 highs….

$ETH: Following the 3rd touch of its 5-year-long Ascending Triangle bottom regression trendline in June, this remains in a very strong uptrend. The move we’ve seen in recent weeks is just a correction, as it now looks to be shaping the same structure from June 2025 that helped send it back to the 2021 highs…. I’d expect the same outcome from this setup now. No new lows coming.
Overall, Ethereum remains in a strong Ascending Triangle accumulation pattern.


#Bitcoin: $78K support backtest, and it’s time to push towards $94K.
As I’ve been saying, we’re already in the continuation phase, so be more bullish…. My expectation is a flip of $94K when we get there, followed by a straight shot back to ATHs.
And #Bitcoin is now turning that $78K resistance into support on the weekly TF.
Note how bullish confirmation came for most people in the mid-$80Ks, and how they were starting to flip bullish? Now, as we backtest the $78K support, they’ve become bearish again.
The irony is hard to miss.
$ETH: Exactly the same megaphone structure from June 2025 that helped send it straight back to the 2021 highs….
$ETH: Following the 3rd touch of its 5-year-long Ascending Triangle bottom regression trendline in June, this remains in a very strong uptrend. The move we’ve seen in recent weeks is just a correction, as it now looks to be shaping the same structure from June 2025 that helped send it back to the 2021 highs…. I’d expect the same outcome from this setup now. No new lows coming.
Overall, Ethereum remains in a strong Ascending Triangle accumulation pattern.

The $78K weekly TF backtest following the initial rally off the lows… I didn’t think there was any reason to overcomplicate this, other than emotions getting in the way for most. #Bitcoin

And #Bitcoin is now turning that $78K resistance into support on the weekly TF.
Note how bullish confirmation came for most people in the mid-$80Ks, and how they were starting to flip bullish? Now, as we backtest the $78K support, they’ve become bearish again.
The irony is hard to miss.


“Midterm this, midterm that.” #Bitcoin final drop coming in Q4, cause history ya know… Smh.
Was seeing this all over the timeline yesterday… Doomers just gotta doom. It sells.

And they’re back at it… It only took some correction for the history teachers to start explaining why Bitcoin would still have a “final drop” in Q4 because “history”…
Meanwhile, look at the descending triangles that led to the final drops & bottom in Q4. The bearish pattern was already there way before! Both in 2018 and 2022.
But doomers gotta doom, I guess… #Bitcoin


#SPX: So far, the upper regression trendline of the Expanding Triangle continuation pattern has come to the rescue once again! Marking its 3rd backtest. . . The regression trendline path it is, then. 🤷♂️

2 paths I’m currently looking at on #SPX, as I still don’t see a 2008-style crash happening here yet.
Currently, it’s sitting on the upper regression trendline of the Expanding Triangle continuation pattern, which has acted as support on multiple backtests. It could do so again here, or we see the full resolution of the M-top pattern towards 7,300ish before reversing.
𝐃𝐚𝐯𝐢𝐝𝐎𝐧𝐂𝐫𝐲𝐩𝐭𝐨 📘 retweeted
2 paths I’m currently looking at on #SPX, as I still don’t see a 2008-style crash happening here yet.
Currently, it’s sitting on the upper regression trendline of the Expanding Triangle continuation pattern, which has acted as support on multiple backtests. It could do so again here, or we see the full resolution of the M-top pattern towards 7,300ish before reversing.
#SPX: Back in February, I was expecting 7,200 and 8,000 in 2026. We got 7,200 in April and 7,900 in October.
Now, with SPX starting to lose support here, it seems 8,000 in 2026 is out of the picture for now, as it is shaping into an M-top pattern. Measured move target is 7,300ish.
