

State of the art Orderflow and GEX/OptionFlows analysis and trading software.
Ras Al Khaimah
Joined September 2025
- Tweets271
- Following8
- Followers3.8K
- Likes59





LOL

@PietroValastro_ came to my floor and forced me to shoot trading content.
So I timed a swing trade with orderflow and played Minecraft the entire session.
Fun session tho. youtu.be/0v_nJvlYAY0?si=imjv…


Big Trades don’t tell you where price goes. They show you where large trades hit the market.
Big Trades → significant participation.
DeepPrint → a closer look at activity on the footprint.
This session shows what happens when both come together ↓
Big Trades don’t tell you where price goes. They show you where large trades hit the market.
Large trades → significant participation. Watch how price reacts.
This session shows what happens when big trades hit the market ↓


That’s what makes DeepCharts different. You get the tools, the education, and access to experienced traders sharing how they approach the markets, all in one place.


Volume Profile doesn’t tell you where price goes. It shows you where the market traded the most.
High volume → acceptance. Price builds value.
Low volume → strong one-sided aggression.
Watch how the volume distribution develops alongside price ↓


deepcharts ™ retweeted

100%
The team at @Deepcharts is truly pioneering something special. You guys really just came in out of nowhere and completely changed the game
2 signals today, missed the first entry and second entry was very late and awful entry (error by me)
But overall if you took both signals, 2 wins for 2R each
Have a few other indicator ideas i am cooking up this weekend too
Exciting stuff
$SPY $QQQ


deepcharts ™ retweeted

DeepCharts super efficient. Got multiple windows and charts on all these guys and its resource utilization is low @Deepcharts Ninja has become very laggy at times.

Zero gamma is where the map’s estimate changes sign.
Above it, moves tend to fade. Below it, they tend to run. What price actually does at the crossing is a tape-reading job — not an assumption.
The honest anatomy of the flip, episode 9:
deepcharts.com/blog

Three DeepGamma layers on one $ES session:
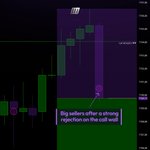
Dynamic Wall: it slid lower all afternoon, and price kept getting rejected right at it.
GEX Profile: the largest market-maker gamma strike sat at 7685. Both selloffs stopped just above it.
Hedging Profile: shows how dealers will hedge at each strike, and whether that flow speeds a move up or slows it down.
Ceiling from the wall. Floor from gamma. The range drew itself.

deepcharts ™ retweeted
Spending alot of time vibe coding my own indicator in @Deepcharts
Indicator is looking very promising, tweaking a few more settings and we might have created something amazing
Similar to NQ Effort but with my own thesis/ideas for a setup
$SPY / $ES_F
$QQQ / $NQ_F

Gamma doesn’t tell you where price goes.
It tells you how price moves when it gets there.
Amplifying hedging → moves extend. Volatility expands.
Positive gamma → moves get absorbed. Price gets pinned.
This session had both, in that order ↓

