

Ichimoku TA on $BTC | PhD in Semiotics
Earth
Joined May 2021
- Tweets13.6K
- Following6
- Followers14.1K
- Likes18.7K







Pinned Tweet
📚Ichimoku Theory - Free Learning Material
Below is the full list of the 17 educational threads I've posted on Ichimoku Theory.
If they don't contain the entire Theory they probably contain more than 90% of it. I think that it's fair to say that it's impossible to find in written English this information for free.
The amount of characters in all threads are approximately 100,825.
One standard page is 1800 characters so this is ~56 pages of pure text.
But, in reality books are often issued with bigger line spaces so they fit less than 1800 characters per page.
If we account for that and all graphs, videos and images, I think that the page number can go up to 75-100.
This is an entire book for you - here, for free.
Enjoy it, but don't forget to share it.
You got it for free, share it for free.
If you like it but you don't feel like sharing it you can still pray for the sinful soul of Doctor Cat.
Threads index 👇
1. The Ichimoku TA system xitter.cf/DoctorCatX/status/1807…
2. Tenkan Sen xitter.cf/DoctorCatX/status/1810…
3. Kijun Sen xitter.cf/DoctorCatX/status/1813…
4. Real and fake TK crosses xitter.cf/DoctorCatX/status/1815…
5. SSA xitter.cf/DoctorCatX/status/1817…
6. SSB xitter.cf/DoctorCatX/status/1822…
7. Kumo xitter.cf/DoctorCatX/status/1827…
8. Chiko Span xitter.cf/DoctorCatX/status/1830…
9. Sanyaku Signals xitter.cf/DoctorCatX/status/1834…
10. Forecast lines xitter.cf/DoctorCatX/status/1938…
11. Trend and range
xitter.cf/DoctorCatX/status/1945…
12. Key levels for visit and reversal
xitter.cf/DoctorCatX/status/1946…
13. Bull and bear traps
xitter.cf/DoctorCatX/status/1946…
14. Time Theory
xitter.cf/DoctorCatX/status/1951…
15. Wave Theory
xitter.cf/DoctorCatX/status/1951…
16. Price Theory
xitter.cf/DoctorCatX/status/1951…
17. Kyushu Ashi xitter.cf/DoctorCatX/status/1953…


Dr Cat is the only influencer in the entire Twitter history with a 9 to 5 job

$BTC Bitcoin
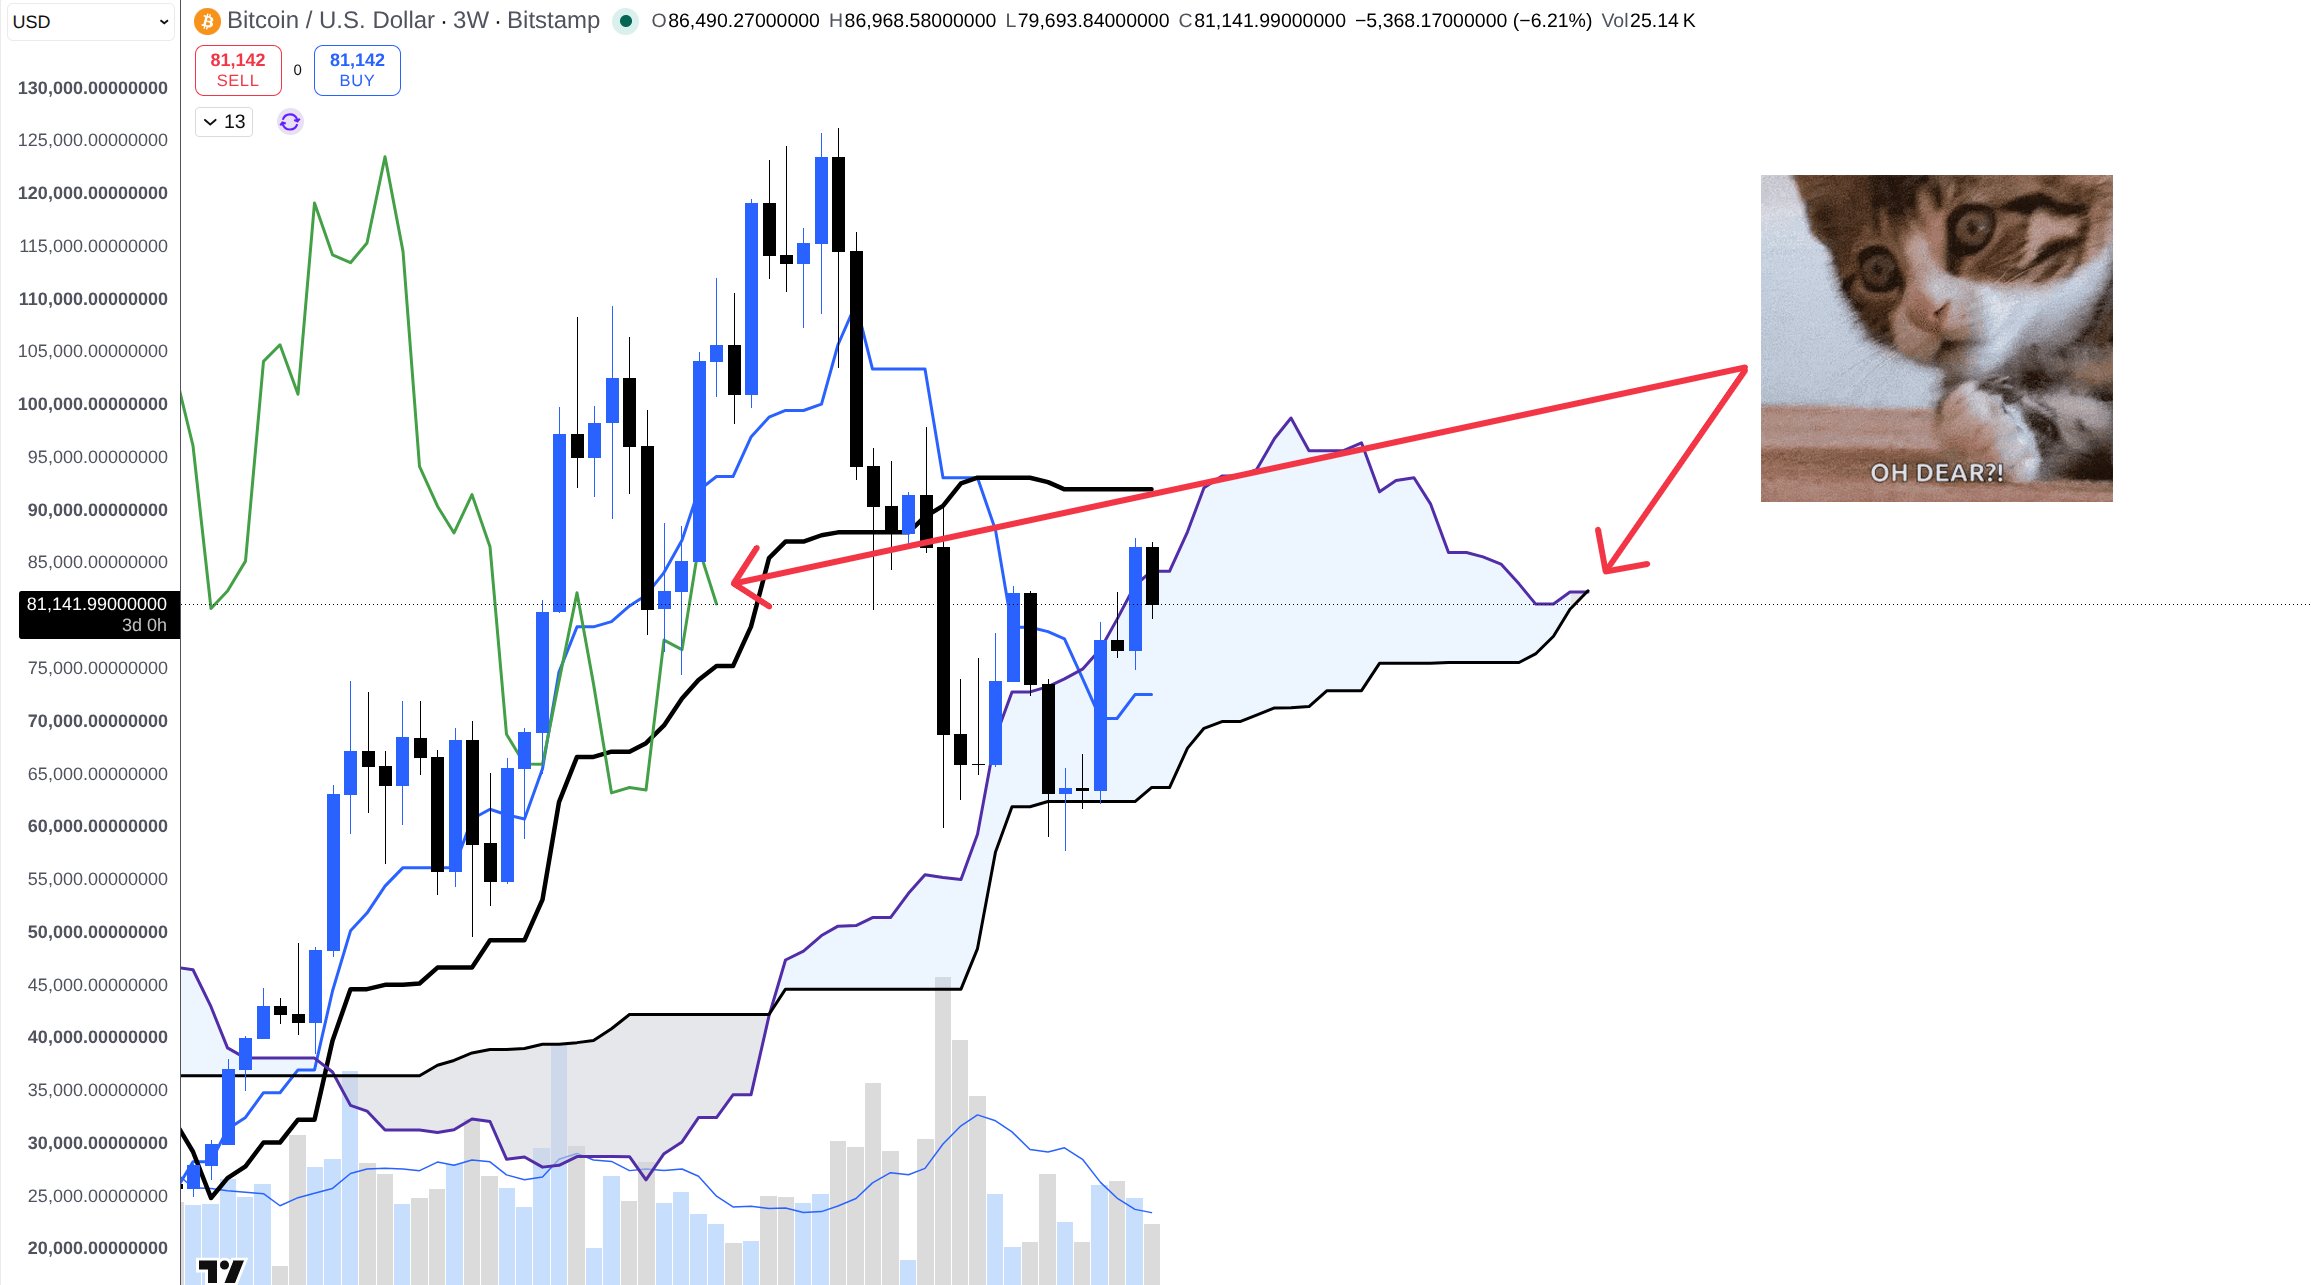
This is a 4th perspective of the base case presented already on 3W, 1M and 2M, this time on the weekly.
The price in the cloud chops both according to Ichimoku Theory and in practice as you see.
So the most likely scenario is the exciting PA in red for at least half a year ahead. Of course this is a very rough drawing, it simply means chop in the cloud, with potentially some fakeouts around it.
72K to 92K is the main range channel but can't write off even low 100s and even that wouldn't be a bull market yet.
Unless we see a clear invalidation on the 2M close levels presented in the main forecast, I would ignore all the noise of bullish calls for the next months and stick to the old plan step by step: xitter.cf/DoctorCatX/status/2110…
October 2026 to close below $94,181
December 2026 to close below $107,164
February 2027 to close below $108,268
April 2027 to close below $109,554
June 2027 to close below $87,496
I think that it will be very boring time to watch the price but a lot of people on Twitter will keep calling for higher every day so they can boost their followers and earn more money from Discord and Patreon while their TA skills are close to zero.
Eventually after 9+ months the bull market will most likely start and they will say "I told you".
No need to waste your time listening to them in the meanwhile, in my humble opinion.
I don't have Discord and Patreon so in the meanwhile I will keep hard working at McDonald's.
$BTC Bitcoin
To be more precise, the current expectations are:
October 2026 to close below $94,181
December 2026 to close below $107,164
February 2027 to close below $108,268
April 2027 to close below $109,554
June 2027 to close below $87,496
by Bitstamp prices.
This is step by step completing the minimum duration of the bearish Kihon Suchi cycle of the Kyushu Ashi candles which is 9-2 = 7.
If any of these is proven wrong, the entire forecast chain afterwards is invalidated.
The last such unexpected invalidation occured in the 5 candles cycle in 2019.
More educational details you can see here:
Kihon Suchi: xitter.cf/DoctorCatX/status/1951…
Kyushu Ashi: xitter.cf/DoctorCatX/status/1953…

You heard it from the second person on Crypto Twitter who can read Ichimoku charts.
Yes there are only two of us.
Read the pinned tweet and don't fall into dumb traps.
The only characteristic of the kumo AT THE PRICE that matters in the present moment is the kumo thickness.
Everything else which concernes the current PA, including kumo color, slope, crosses: is in the future kumo.
By the moment the price gets to it, it is old irrelevant information from 26 periods in the past.
You don't even need to read Hosoda to understand that this is common sense.
If you take into account the information at the current kumo that's the same as if you look at MAs 26 candles in the past - this is completely irrelevant old information.


Don't be ignorant like him, learn Ichimoku from the pinned tweet.
The kumo color below or above the candles is completely irrelevant for being bullish or bearish.
What matters is that kumo color in the future.


It took @CredibleCrypto 8 hours to get me from 13K to 13.9K followers.
8 months later I got from 13.9K to 14K.

I'm superstitious so it really bothers me that the second number starts with 13.
@CredibleCrypto this time I need your help

Dr Cat retweeted
I've discovered that Don is so naturally talanted in reading the market that he is very rarely wrong on high timeframes.
And the very few times I can confidently tell he's wrong is when Ichimoku shows that in a very obvious way.
So I've figured that if you use Don + Ichimoku you can get virtually 100% accuracy. Most of the time when he confirms what Ichimoku hints for for you become even more confident in Ichimoku, let's say from 70% to 99%.
And the very rare occasions when he's wrong I've noticed that normally Ichimoku screams with full confidence that he's wrong. For some reason, exactly when he's wrong, the Ichimoku chart has always given the highest levels of certainty against him.
My bet is that now he will be wrong.
No bull market on the monthly for months ahead is what Ichimoku is telling me. As covered with so many arguments on so many timeframes in multiple posts recently.
I hope so badly to be wrong this time so I can finally quit my job at McDonald's. But I doubt it.

I've discovered that Don is so naturally talanted in reading the market that he is very rarely wrong on high timeframes.
And the very few times I can confidently tell he's wrong is when Ichimoku shows that in a very obvious way.
So I've figured that if you use Don + Ichimoku you can get virtually 100% accuracy. Most of the time when he confirms what Ichimoku hints for for you become even more confident in Ichimoku, let's say from 70% to 99%.
And the very rare occasions when he's wrong I've noticed that normally Ichimoku screams with full confidence that he's wrong. For some reason, exactly when he's wrong, the Ichimoku chart has always given the highest levels of certainty against him.
My bet is that now he will be wrong.
No bull market on the monthly for months ahead is what Ichimoku is telling me. As covered with so many arguments on so many timeframes in multiple posts recently.
I hope so badly to be wrong this time so I can finally quit my job at McDonald's. But I doubt it.
Apparently the @memeland MVP which I sold for 130K USD / 56 ETH in 2023 is now worth 1.4K USD / 0.59 ETH.
I may suck at a lot of things but at least once I sold the top before a 99% dump.
Sending blessings to all the Memeland permabulls who were trolling me back then.
And double blessings to the person who paid me 130K for this JPEG whoever they are.


$BTC Bitcoin - Update
The price is struggling too bad on the daily, the last bullish TK cross never got validated and now there is a bearish one.
Of course, $ETH looks even worse and no surprise as it also looked worse weeks ago, as posted previously.
For this reason, in the realtively short term, the expectation for fresh highs after the 12th of October and 92-93K is shifted from default expectation to best-case scenario.
Some pathetic moonboys in the comment section suddenly started to turn aggressive and to expect an immediate bull run, which is exactly the opposite of what Ichimoku indicates.
Probably they are the ones who missed to buy the bottom and finally bought here so I guess some cool off may be needed to shake them off. Whether it's price- or time-based.
Mid term it's quite hard to evaluate as the price is inside the weekly kumo where it becomes very chaotic. And as already posted multiple times, the default expectation for more than half a year ahead is range/chop on very high timeframes.
The the upside while 93K remains a reasonable border of that range but to the downside it's more difficult to evaluate for me, at least for now.

$BTC Bitcoin
If the 82K high is taken the market is expected to keep pumping minimum to 89.5K and to top on the weekly no earlier than the 12th of October.
The next major weekly cycle low is scheduled between the 9th of November and 13th of December.

$BTC Bitcoin
To be more precise, the current expectations are:
October 2026 to close below $94,181
December 2026 to close below $107,164
February 2027 to close below $108,268
April 2027 to close below $109,554
June 2027 to close below $87,496
by Bitstamp prices.
This is step by step completing the minimum duration of the bearish Kihon Suchi cycle of the Kyushu Ashi candles which is 9-2 = 7.
If any of these is proven wrong, the entire forecast chain afterwards is invalidated.
The last such unexpected invalidation occured in the 5 candles cycle in 2019.
More educational details you can see here:
Kihon Suchi: xitter.cf/DoctorCatX/status/1951…
Kyushu Ashi: xitter.cf/DoctorCatX/status/1953…
$BTC Bitcoin - Update
Based on the same logic which on the 1st of March correctly forecasted that April would close above $70,202: May 2027 should close below $87,496.
This is based on the assumption that the 2M timeframe has started to build a bearish cycle of Kyushu Ashi candles with a minimum cycle duration 7=9-2 candles.
This is in line with my base case scenario which I've already shared roughly: 1+ year of range before the bull market begins.
We could consider an invalidation if December 2026 closes above 99.8K (CS gets above the candle high on the monthly) or if we get another bullish KA candle on the 2M chart breaking the current bearish cycle.

$BTC Bitcoin - Update
OK it paused a bit lower than that at $87,373.
Normally when it goes very close to resistance without touching it and consolidates below it, it blasts through resistance when it tests it.
In any case these are small details, this bullish move is expected to go at least to 92K and at least till the 12th of October as already explained.
The amount of people asking for a retrace is mind-blowing, I can sense the same situation as April 2025 when everyone was asking the same and the market kept going up without retracing.

$BTC Bitcoin
The first meaningul pause should not come before 87.9K (the monthly Kijun).
But even if it comes it should be just a pause... we have a long way to go till the 12th of October.
So far seems a bit too fast of a pump for now as we target 92K-93K.
I'm very curious to see how this unfolds.

$XRP / $BTC Ripple / Bitcoin
I just found an old post by Dr Cat from January 2026 where he said about the CS tracing:
To the upside it may get interrupted by a bull breakout around November/December 2026 and September/October 2027.
So there is still a small chance to break up in November/December 2026.
But to consider this possibility, October must close above 1734.
If not, we wait for after August 2027 which remains the highest probability.

$XRP Ripple - Update
On the $BTC pair:
On the 2M timeframe, if February closes between 2040 and 2088 the price should continue to range for around 1-2 more years because of the CS tracing: xitter.cf/DoctorCatX/status/1830…
unless the CS tracing is prematurelly interrupted - which is not the default expectation.
To the upside it may get interrupted by a bull breakout around November/December 2026 and September/October 2027.
But as this is a 2M scale here +- 1 candle time inaccuracy can mean a lot so keep that in mind, these are rather rough estimations.
The most important support 2040 is perfectly held on all high timeframes which is very impressive provided that most altcoins are in bear markets both against $BTC and $USD.
If 2040 is lost on the monthly, this might be the first hint for a potential bearish breakout and interruption of the CS tracing to the downside.
However, in this case the situation needs to be reevaluated because it depends entirely on the time of this event, if it happens at all.
I.e. if that happens it would not automatically bearish but it would be a big warning sign whose consequences depend on its timing.
On the $USD pair:
As already posted at Sunday's close, the weekly chart has flipped bearish and the minimum target is the 2M SSA at $1.392. If that is lost: $0.917 (the high at CS on the 2M) - $1.04 (monthly SSB).
Overal, the $USD pair looks progressivelly bad as $BTCUSD does.
However, currently the $BTC pair doesn't look bad and it is still holding the most important level.
As the chance for $BTC to visit 65K in 2026 is over 70% now, it's important to monitor at what price level $XRPBBTC would be at the time.
If it is still holding 2040 satoshi that would be very impressive and would keep $XRPUSD above $1.3.


The other argument for that is that it's impossible for $BTC to flip the monthly chart bullish before April 2027.
Due to the common low of Tenkan Sen and Kijun Sen.
If you remember, last year I made posts about that for $ETH when everyone was bullish at the top. I kept explaining that it can't flip bullish in 2025. And you all remember what happened at the end.
I sincerely hope to be wrong this time as if I'm wrong I will make money faster. But I need to say what makes sense to me.


$BTC Bitcoin - Update
Based on the same logic which on the 1st of March correctly forecasted that April would close above $70,202: May 2027 should close below $87,496.
This is based on the assumption that the 2M timeframe has started to build a bearish cycle of Kyushu Ashi candles with a minimum cycle duration 7=9-2 candles.
This is in line with my base case scenario which I've already shared roughly: 1+ year of range before the bull market begins.
We could consider an invalidation if December 2026 closes above 99.8K (CS gets above the candle high on the monthly) or if we get another bullish KA candle on the 2M chart breaking the current bearish cycle.
$BTC Bitcoin - Update
To be more specific, the 2W resistance is $79,466.5 - $81,138 between the 2nd of March and the 15th of March and $74,434 between the 16th and 29th of March.
And the weekly resistance is $78,934.5 until the 15th of March.
In the same time, the window for the next weekly high is until the 29th of March.
So if a pump to around 79K happens from here it should be faded by the 29th of March, even though the most obvious period for that would be by the 15th of March.
In the same time, based on Kyushu Ashi on the 2M, April should close above $70,202.
If the macro bottom is in the price should probably establish a wide range for a few months before a weekly reversal.
If the macro bottom is not in, the price will probably go much lower than most people expect, i.e. 20-30s and should not bottom at 45K which is the most crowded target. But that's just a sentiment-based guess and there is no need to predict anything.

$BTC Bitcoin
Small correction: June 2027 should close below $87,496.
It's the candle opening in May 2027 but this is a 2M timeframe so it closes in June.
I will post if invalidated, for now this is the base case scenario.
$BTC Bitcoin
Small correction: June 2027 should close below $87,496.
It's the candle opening in May 2027 but this is a 2M timeframe so it closes in June.
I will post if invalidated, for now this is the base case scenario.
$BTC Bitcoin - Update
Based on the same logic which on the 1st of March correctly forecasted that April would close above $70,202: May 2027 should close below $87,496.
This is based on the assumption that the 2M timeframe has started to build a bearish cycle of Kyushu Ashi candles with a minimum cycle duration 7=9-2 candles.
This is in line with my base case scenario which I've already shared roughly: 1+ year of range before the bull market begins.
We could consider an invalidation if December 2026 closes above 99.8K (CS gets above the candle high on the monthly) or if we get another bullish KA candle on the 2M chart breaking the current bearish cycle.
At this point a dip below 79K is highly unlikely because this is the kumo level at CS.
If it goes below that most likely it will not be a dip. But for now it's a healthy breakout and after this as I have explained in the past, it is extremely rare for CS to go inside the kumo.
If you remember when the breakout in May 2025 happened at ~90K I explained the same thing and it kept going up without retrace.
Of course, this is related to the current bullish move targeting mininum 92K and expected to continue minimum till the 12th of October.
The default expectation remains to follow ~ 1 year of chop during which a lot of bigger retraces may come. If that is invalidated I will post.


$BTC Bitcoin
The first meaningul pause should not come before 87.9K (the monthly Kijun).
But even if it comes it should be just a pause... we have a long way to go till the 12th of October.
So far seems a bit too fast of a pump for now as we target 92K-93K.
I'm very curious to see how this unfolds.
