

Crypto market making & quant research | Recovering physicist, ex-Citadel | Building @botfedai
Joined May 2024
- Tweets2.2K
- Following544
- Followers1.9K
- Likes1.6K



Pinned Tweet
When doing market making or cross exchange arb in crypto we discussed some of the issues of computing fair price from multiple geo-distributed data feeds.
Your quotes will arrive asynchronously from Binance, Bybit, Coinbase and so on, and each will be an indirect measure of fair price.
For example, how do you weigh the Binance and Bybit quotes that came in 35ms and 75ms ago against that Coinbase quote that came in 15ms ago? What about when the ordering is reversed?
Each exchange has a different level of liquidity, error, and basis, so even if the quotes were all equally fresh, there'd still be some decisions to be made. But latency adds an additional layer of complexity.
One mental model for this is ruler theory. Imagine trying to combine the measurements of a bunch of different rulers, each with their own bias (μ) and error (σ), into one optimal measurement.
Bias means a particular ruler is on average off from the truth by a consistent amount. Error means there is a random fluctuation by how much it is off from this average amount, sometimes a lot, sometimes a little, but usually within one stdev around the truth.
In physics, the way to weight each measurement is via precision weighting where each ruler is weighted by its inverse variance:
~ 1/σ²
A quote from a particular exchange is like a ruler measurement of fair price in that it too has its own bias and error.
The dominant part of bias is easy to measure, it is just basis, and a good start is to compute a rolling mean.
Error is a bit more complex. It will depend on liquidity, spread, volatility ... and time elapsed.
BTC-USDT on Binance is expected to be a less errorful measurement of BTC than the same instrument on say, Kucoin. But BTC-USDT on Binance 1 second ago is expected to be more errorful than BTC-USDT on Kucoin 10ms ago.
So there is an innate component to error and a time component. Total error squared will look something like this:
error² ≈ ε²_exchange + σ_price²·τ
where τ is the amount of time that has elapsed from when the quote was emitted to when you registered it, and ε²_exchange is the error unique to that instrument on that exchange (and at that particular point in time). For the time dependence, the assumption here is Gaussian diffusion, which is a defensible first order approximation when you are not near a significant liquidity event.
So errors have a component that grows at a speed proportional to variance, creating a kind of uncertainty cone as they propagate forward in time.
This tells you roughly how to weigh different quotes from different exchanges arriving at different times.
Below are plots from two models built on this intuition. Both are measurably better than just using the Binance mid-quote, and in production, more robust against feed glitches on any single exchange.
We'll discuss in more detail some concrete models that incorporate this intuition, and some that work surprisingly well while ignoring parts of it, in a subsequent post.


When market making, cross asset correlations are your friend.
What's funny though is you can footgun yourself here if you assume markets are too efficient.
Suppose you're on a secondary exchange making BTC, and some ALTCOIN, using something like the binance feeds as your source of truth.
Your mm engine sees BTC jump 2bips and immediately reprices ALTCOIN, canceling your inner ask. But then nothing happens to ALTCOIN for the next couple of ticks, so your system forgets about the BTC jump and requotes ALTCOIN at the level implied by your feed + some basis adjustment.
A few milliseconds later ALTCOIN does jump and you get picked off. So you had the right idea but the wrong execution. The market for ALTCOIN was actually less efficient than you assumed, and you backed off the signal too quickly.
What's the solution? Modeling. You need to analyze tick data and model the correlations temporally.
The precise impulse response function is something to be discovered empirically, but it's well motivated by the fact that there's an easily observable statistical relation:
ALT_return ~ beta * BTC_return + epsilon
(Or more generally ALT ~ beta_i * f_i + epsilon where f_i are factors.)
For most coins. This leads to all kinds of modeling ideas.
When market making, once you have your tail latencies under control and an accurate, fast OMS, it becomes easier to crank out large daily volume with relatively little capital.
This is when fee tiers, small edges and a bit of alpha really add up. A 0.5 bip edge on $10M daily volume translates into ~$182K a year, and there's no reason to stop there.
A common point of confusion in alpha modeling is how to combine alphas over different forecasting horizons into one integrated signal. Say you have a model trained to forecast a small edge over the next 1s, another over 1min and another over 10min.
One of the first things I like to do is break the prediction period into disjoint intervals, 0 to 1s, 1s to 1min and 1min to 10min, and rerun each model on these segments.
This lets you tease out whether the longer horizon model is really adding value over its horizon, or whether it's just a shorter term model dressed up in a longer one's clothes.
It also lets you recover something like a forward looking alpha curve, which has consequences for your optimal execution path, and can show you to what extent the signals are genuinely orthogonal.
Always fun when you see msgs spike to 10k/s in your market making dashboard before you realize the market is tanking hard.
And because you have good risk management and excellent tail latency you aren't down at all .. right?
When trying to fix negative markouts in your market making system, top of the list should be digging into fills that happened during inflight cancels.
These are trades your system knew were going to be toxic, but you got filled anyway.
This may happen because you're still too slow on the tails and quoting too tight for your latency, or it could be an inconsistency in your business logic.
Tracking these events involves accepting a small amount of overhead in the hot path but is generally worth it, especially in the testing phase with smaller amounts of capital.
When such events cross a certain threshold, I like to attach a cancel and fill context for detailed analysis of the system state before and after. This can include details about the BBO, alpha states, latency deltas, skew, etc.
Then, once such events have been reduced to an acceptable level, compile them out to shave the extra nanos off the hot path.
If you're a market maker or taker in crypto, venue selection is one of the most important decisions you'll make. You need a visceral understanding of why it matters, especially starting out, as I see too many people going straight to tier A. Venue selection can make or break your profitability as a boutique MM (and you are boutique unless you're doing a significant % of tier A volume).
Here's the mental model I keep in mind.
A group of people stand around a chute. Every so often a turkey drops out. Whoever catches it keeps it, so everyone muscles each other for position, hunger games style. Some turkeys have grenades strapped to them. And in the surrounding hills are snipers who are constantly picking MMs off.
Some arenas have nice fat turkeys, few grenades, and unskilled snipers. Your fellow MMs are farmers with pitchforks.
Other arenas, most turkeys have grenades, the snipers are Navy SEALs, and your fellow MMs are Delta Force operators, skilled at grabbing the good turkeys before you and letting you blow up on the grenades. Meanwhile, you can't remember the last time you did a pushup.
So given this spread, which arena do you pick? Does it make sense to spend some time watching as a spectator before jumping in?
I'll cover specific techniques for assessing venue quality and profitability in a follow-up post.
🤖 Made with AI


If you do market making or cross-exchange arb in crypto, better vol estimates are one of the easiest ways to lower your adverse selection rate, as these feed directly into your quoting spread.
(or at least they should feed into your quote spread, right Han?😅)
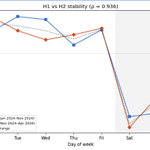
Speaking of, there is a well documented Trump effect in vol seasonality.
Trump's habit of tweeting major decisions on Sundays has created a measurable bump in background vol.
The blue curve is Biden, the red curve is Trump.
A solid vol estimate will take some form of seasonality into account (either directly, or indirectly via multiscale).
More on models in a future post.
Or you could just treat your mm operation like the Millennium Falcon (who am I to say).

While market making you may periodically get "quotes from the future" from any one of your N geo-distributed exchange feeds, meaning the exchange's self reported timestamp exceeds your own. This can lead to noise in your fair price estimates.
What do you do in this case, and what is the likely cause?
Well, if you are consistently getting quotes from the future then the first place to look is at your own system time service.
As a first step you'd want to have something like chrony setup, and if your trading engine is in Tokyo, for example, you want it setup with a config optimized for Tokyo (ie: you'd want your NTP service pointed at Japan based sources and not random US based ones).
Say you've done that, and the quotes from the future seem to go away.
Great, but there is still some doubt that there may be some time offset between the different self reported timestamps from each exchange, relative to your own time, and if some of the feeds you are listening to are geographically far away this offset could still be large.
For example, if you are located in Tokyo but that Coinbase quote comes in with a timestamp 10ms ago, either the speed of light has been violated by about 60ms or there is still some relative drift in the clocks.
How do you detect this?
A simple approach is to setup a minimum latency floor for each exchange. You can compute this floor by running a ping process to each exchange and tracking the fastest round trip. Half of that is your latency floor, and any quote that claims to have arrived faster than that has effectively come from the future telling your system it needs to adjust the relative clock.
(See the ping example below from a Tokyo AWS box.)
This approach is superior to a theoretical speed of light calculation approach because it takes into account real world realities of fiber optics layouts, etc.
Detailed clock drift correction isn't the first optimization to do beyond just setting up something like chrony. But it is something that can give you an edge (or save you from losing) especially during market calamity when misordered quotes are most costly.
More on this in a follow-up post.

As a market maker one of the most important skills you should master is the skill of not getting filled.
I highly recommend testing your system with the following game, which I think of as mongoose versus cobra. (You as the mm are the mongoose, the other participants are the cobra.)
Set it to quote ridiculously wide for your market, something that feels like it should be easy, say ±100 bps on BTC, and see how long you can go without getting filled. Should be easy right?
99% of beginner mm systems will fail this test after an inadequate amount of time. Feeds will go down, back pressure will build up, random GC farts, the list is endless.
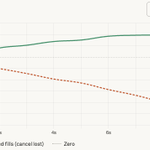
Barring a lucky positioning during a liquidation event, you'll see how your markouts are almost always negative when getting filled against your will (you might see something like in the graph below - fake data, illustrative purposes only).
Once you have mastered not getting filled at 100bps, start tightening your spreads, and see how far you can push it.
The reason why mastering the skill of no fills is so important is because nearly all of a market maker's losses come from unwanted fills.
Going through this process will force you to harden your system in ways you did not expect, and you will be in a much better position to print.

Tired of being adversely selected?
Previously we mentioned the multiple advantages to forecasting vol as a market maker or algo trader in crypto.
But what are some sensible ways of forecasting vol?
The first question I'd ask is, how do I even decide if I am doing a good job forecasting vol, or in more technical lingo, what loss function should I use?
Obviously I need to compare realized vol to my forecasts, but how exactly?
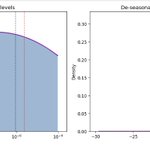
The first thing to note is that while variance has a heavily right-skewed distribution, and is never negative, log of variance has a roughly Gaussian distribution. See the graph below.
So while MSE on var would be a lousy and poorly motivated loss function (MSE is derived from MLE assuming Gaussian), MSE on log var should work pretty well, and any fit using this loss function would be motivated by an application of Bayes theorem and MLE.
Loss = (1/T)Σ (log σ²_t - log h_t)²
where h_t is predicted vol and σ is realized vol. Can we do even better?
Yes, a bit.
Looking at the log variance distribution we notice that it has a significant skew and kurtosis.
Any trader would know this intuitively. Volatility when it spikes, spikes in a massive way, interleaved with periods of unusually low vol and intermediate vol.
The loss function that is best motivated in this case is QLike, and it turns out that you can show it is the optimal loss function to use with extremely relaxed assumptions on the underlying distributions:
Loss = (1/T)Σ [σ²_t/h_t - log(σ²_t/h_t) - 1]
And the beauty is we don't need to know which distribution it is. It could be a mixture of distributions (ie: corresponding to different regimes via a latent variable), for all we know (and as suggested by the plot in level space below).
For our purposes though, as practical traders, the main thing to notice is that this loss function penalizes more when we underestimate vol (h smaller than σ) than when we overestimates (h larger than σ).
This is good, as market makers we lose more when we underestimate vol (tighter quotes than optimal -> more adverse selection) than when we overestimate it (wider quotes than optimal -> no fills -> less adverse selection).
In practice qlike vs mse might not be a game changer, given a good underlying model, however it is one of those optimizations to keep in mind.
So now that we got that out of the way, which ways of modeling vol are good and which are bad?
Stay tuned for the next post. 👇

Market makers, even for linear products such as crypto perps, are short gamma (and long "theta").
There is an odd but understandable misconception by some practitioners that this is not so, because "wait, aren't greeks an options thing?"
The trick is to understand that while the underlying product is linear (say PERP on BTC) a market maker's payoff function is not.
The limit order itself has a non-linear payoff which introduces short gamma exposure.
While understanding this is not strictly necessary for being profitable, it's a neat insight that sheds light on what exactly you are doing when placing a quote, and what exactly needs to go right to NOT consistently lose money.
Indeed, market making is a notable example of a probabilistic game where you will consistently lose money even with EVEN odds from the underlying (just try to market make on a random walk and you will see how your pnl curve is down and to the right with prob -> 1 as t -> infinity).
One insight that you get from this, for example, is the importance of good vol estimates. If you are short gamma, then it is highly advantageous to have a good prediction for realized vol.
If you do market making or cross-exchange arb in crypto, better vol estimates are one of the easiest wins you're probably leaving on the table.
Beyond using simple models like an EWMA of squared returns understanding that vol has a strong seasonality component is an easy win.
The intraday vol of crypto has been pretty stable over the years including over different US presidencies.
In the plots below you can see that BTC intra day vol spikes around US opening hours (roughly 13:00-15:00 UTC).
This makes sense since much of crypto vol in recent years has been driven by different economic reports out of the US, plus it's the most liquid market in terms of public assets as a whole.
There is a second smaller hump around Asia open (00:00-02:00 UTC), which also makes sense, given that Asia is the number two market after the US.
We can also see that the intra day pattern is nearly identical under Biden in 2024 (blue) as with Trump during 2025 and 2026 (red).
(Technical note: The estimates here were done using Garman-Klass on 5 minute OHLCV bars using BTC perp data from Binance).


LLMs have been a blessing for small crypto market making teams. First time in history you can onboard a new exchange in a few hours, using a low latency language like Rust.
Doing this responsibly still assumes a certain level of engineering competence to keep the AI in check and ensure it uses solid design patterns, but this will only improve.
I think vibe coding in Rust will soon replace much of what used to first be done by competent individuals in Python (in the spirit of let's figure out the design first in an easy language then optimize) as far as performance sensitive tasks are concerned.
We'll have to see how things evolve.
Regarding market making in crypto and other asset classes, ensuring your model calibration pipelines are bug free and properly tuned is crucial.
When calibrating your models (alphas, vols, fair price estimators, etc) it is extremely useful to test out your calibration system on synthetic data where you by definition know the answers.
This serves not only to test correctness but to give a sense of conversion rates both in terms of raw number of data points needed, as well as iterations of your fitting algorithms (ex: n_iters in EM).
You'd be surprised how many bugs and other issues are uncovered if you just do this.
