

EPFR offers financial institutions around the world an unparalleled understanding of how money is moving and why, through fund flows and asset allocation data.
Joined April 2009
- Tweets1.8K
- Following191
- Followers3.1K
- Likes98






NDTV Profit link > ndtvprofit.com/videos/busine…
Youtube Channel > youtube.com/watch?v=v5M89ue_…
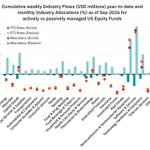
EPFR’s Industry Flows database captured a third straight week of inflows for Semiconductors & Semiconductor Equipment above $5 billion, with their year-to-date total climbing above the $135 billion for passive funds, offset slightly by redemptions of $15 billion from active funds, majority of which has been US led. Passive flows have reached above $120 billion from Software & Services and $77.4 billion for Technology Hardware & Equipment. More striking, actively managed US Equity Funds are underweight Semiconductors and Technology Hardware by the widest margin among all industries, but slightly overweight Software & Services.
For more read our Global Navigator: eu1.hubs.ly/H0zFDW20

𝐈𝐒𝐈 𝐆𝐥𝐨𝐛𝐚𝐥 𝐌𝐚𝐜𝐫𝐨 𝐎𝐮𝐭𝐥𝐨𝐨𝐤 - 𝐔𝐧𝐢𝐭𝐞𝐝 𝐒𝐭𝐚𝐭𝐞𝐬
The US economy carried robust momentum into 2026, consistently beating growth expectations on the back of resilient personal consumption and private investment. However, the composition of this expansion remains highly uneven. Capital expenditure is acutely concentrated in technology and AI infrastructure.
This targeted capital deployment is yielding macro-level dividends, driving a sharp divergence in labor productivity that heavily favors AI-exposed sectors. Since the launch of OpenAI's ChatGPT in late 2022, average labor productivity in highly AI-exposed sectors has surged by 12.4%, compared to just 5.6% in low-exposure sectors.
𝗧𝗵𝗲 𝗰𝗲𝗻𝘁𝗿𝗮𝗹 𝗺𝗲𝘀𝘀𝗮𝗴𝗲? US productivity growth is concentrated in AI-deploying sectors

Download the full report: isimarkets.com/publications/…

𝗘𝘂𝗿𝗼𝗽𝗲 𝗘𝗾𝘂𝗶𝘁𝘆 𝗙𝘂𝗻𝗱𝘀 were again the exception, with redemptions hitting a 13-week high as investors fret about a range of headwinds. In its recently released quarterly outlook, CEIC economists identified the biggest of these headwinds as the perception that Europe is “an AI bystander” and the pressure on Europe’s industrial heartland “from shifting global trade patterns and energy cost disadvantages. Chinese manufacturers continue to capture global market share across passenger vehicles, industrial machinery, and chemicals, eroding European export competitiveness in key third markets”.
For more read our Global Navigator: eu1.hubs.ly/H0zCRS-0

AI enthusiasm, sticky inflation, and China’s market support measures drove diverging investor behavior in late Oct. Tech funds remained a favorite, bonds drew $15.3B, while crypto and frontier debt funds saw outflows.
Read more in our Global Navigator. Global Navigator | Navigating the late-October crosscurrents - ISI (eu1.hubs.ly/H0zBmq30)

The chart below looks at prime contractors in the aerospace and defense industry, alongside major suppliers, space companies and related businesses. Allocation cuts were widespread among many of the industry’s largest holdings by AuM. RTX saw 181 active funds reduce their allocations during August this year versus just nine that increased them, while Boeing (94 vs 4), Howmet Aerospace (176 vs 8) and General Dynamics (127 vs 10), among many others, posted similar one-sided trends, suggesting active managers were taking profits in some of the sector's largest and most widely held names. By contrast, SpaceX attracted strong interest, with 131 active funds increasing allocations compared to just six reducing them. Overall, the data points to a rotation within the sector, with capital moving away from established defense leaders and toward space companies, emerging defense technologies and select Asian manufacturers.
For more read our Global Navigator: Global Navigator | Investors search for the eye of the storm - ISI (eu1.hubs.ly/H0zwsCs0)

EPFR Liquidity Offerings data was recently featured in the @Reuters article, "Buybacks just hit an annual record and it's only October," highlighting the massive amount of cash US companies have committed to reducing the share supply of the US equity market in 2026.
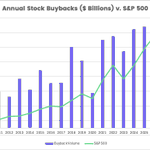
Stock buyback announcements in October surpassed the $1.4 trillion mark for the year for the very first time, and $1.5 trillion is within reach. While the headline number is large, buybacks have been concentrated. Announcements from just three companies have accounted for more than a quarter of the overall total (Nvidia, Apple, JP Morgan Chase).
EPFR data shows that repurchase announcement volume has hit new records in each of the past three years. Strong balance sheets and AI have led to the surge in buybacks among large-cap tech, industrial, and financial firms.
Read the full article with link in the comments and learn more about the buyback bonanza.

• Learn more: tradingview.com/news/reuters…
• The world's prestige media and biggest financial institutions use EPFR to explore global flows. Find out more: isimarkets.com/epfr/

𝗝𝗮𝗽𝗮𝗻 𝗘𝗾𝘂𝗶𝘁𝘆 𝗙𝘂𝗻𝗱𝘀 carried the weight among the Asia Pacific groups, absorbing over $6 billion for the first time since late April, the third time in the year-to-date, and just fourth time on record with the other occurring in 2013. The YTD total has reached above $33 billion (or 2.8% of assets), with funds benchmarked to MSCI Japan steadily climbing throughout the year to reach $12.7 billion total (or 13.4% of their assets). The latest week, however, saw Nikkei 225-benchmarked funds account for more than half of the headline number as they absorbed their second-largest inflow behind a 2019 record. Led by funds benchmarked to Nikkei 225 Leveraged, the more volatile group of all 𝗟𝗲𝘃𝗲𝗿𝗮𝗴𝗲𝗱 𝗝𝗮𝗽𝗮𝗻 𝗘𝗾𝘂𝗶𝘁𝘆 𝗙𝘂𝗻𝗱𝘀 saw inflows lift to a 16-week high, snapping a three-week run of outflows.
For more read our Global Navigator: eu1.hubs.ly/H0ztql_0

• Learn more: tradingview.com/news/reuters…
• The world's prestige media and biggest financial institutions use EPFR to explore global flows of big money : isimarkets.com/epfr/
Geopolitical tensions, rising oil prices and AI investment concerns kept markets on edge. Money Market Fund flows remained volatile as investors prioritized liquidity, while strong demand for US equities and bonds underscored continued appetite for risk assets.
Read more in our Global Navigator: eu1.hubs.ly/H0zrr1L0

𝐈𝐒𝐈 𝐆𝐥𝐨𝐛𝐚𝐥 𝐌𝐚𝐜𝐫𝐨 𝐎𝐮𝐭𝐥𝐨𝐨𝐤 - 𝐐4 2026
Persistent energy disruption, renewed monetary tightening, and accelerating AI investment are reshaping global growth.
📢 Key takeaway: Growth remains resilient, but its drivers are diverging. Understanding where growth comes from, and what sustains it, will define the next phase of the macro cycle.
Download the full report: eu1.hubs.ly/H0zqmJj0
#MacroOutlook #Economics #GlobalMarkets #AI

Among fund groups dedicated to smaller regional markets, 𝗧𝗵𝗮𝗶𝗹𝗮𝗻𝗱 𝗘𝗾𝘂𝗶𝘁𝘆 𝗙𝘂𝗻𝗱𝘀 saw their longest run of inflows since 4Q23 come to an end as investors digested the latest data from the key tourism sector. Analysis by CEIC economist Ian Lim suggests that, despite a recent pick-up in visits from mainland China, “growth has been negative in most recent months, and it is unclear whether a one-off holiday boost can be sustained…the baht has been a headwind. Its strength from late 2025 made Thailand pricier than nearby destinations (Malaysia included), and arrivals growth weakened as the currency firmed. The baht has depreciated since the US-Iran war began, but higher aviation costs and geopolitical risk have kept long-haul travelers away. Arrivals from non-core markets only began to recover in late September.”
For more read our Global Navigator: eu1.hubs.ly/H0zkJ2Q0

On the equity side, meanwhile, 𝗨𝗦 𝗟𝗲𝘃𝗲𝗿𝗮𝗴𝗲𝗱 𝗙𝘂𝗻𝗱𝘀 attracted their biggest inflow since early 2Q25 with over $2.7 billion directed into a single fund tracking the NYSE Semiconductor index and $1.2 billion flowing into three funds with 2x or 3x leverage exposure to the Nasdaq-100. Flows into 𝗞𝗼𝗿𝗲𝗮 𝗟𝗲𝘃𝗲𝗿𝗮𝗴𝗲𝗱 𝗙𝘂𝗻𝗱𝘀 reached a 10-week high after much of the past two months in negative territory, with seven of the top 10 funds with the biggest inflows offering exposure to a single-stock, SK Hynix. Investors bought into the dip, betting that prices would rise after SK Hynix fell 22.7% in the past week.
For more read our Global Navigator: eu1.hubs.ly/H0zhS0L0
𝗛𝗼𝗻𝗴 𝗞𝗼𝗻𝗴 (𝗦𝗔𝗥 𝗼𝗳 𝗖𝗵𝗶𝗻𝗮) 𝗕𝗼𝗻𝗱 𝗙𝘂𝗻𝗱𝘀, meanwhile, snapped an 11-week redemption streak by posting only their third inflow since late April. The latest was a record-high inflow of $153 million, more than doubling their previous peaks set in mid-2016. The headline number was directed by a single mutual fund tracking the performance of local currency bonds in Hong Kong’s market.
For more read our Global Navigator: eu1.hubs.ly/H0zg6c50

Flows into 𝗧𝗲𝗰𝗵𝗻𝗼𝗹𝗼𝗴𝘆 𝗦𝗲𝗰𝘁𝗼𝗿 𝗙𝘂𝗻𝗱𝘀 reached their highest since late July on the back of 𝗦𝗲𝗺𝗶𝗰𝗼𝗻𝗱𝘂𝗰𝘁𝗼𝗿 𝗙𝘂𝗻𝗱𝘀 snapping their longest run of outflows since mid-May with only their fourth inflow of the past 11 weeks, flows into 𝗔𝗿𝘁𝗶𝗳𝗶𝗰𝗶𝗮𝗹 𝗜𝗻𝘁𝗲𝗹𝗹𝗶𝗴𝗲𝗻𝗰𝗲 𝗙𝘂𝗻𝗱𝘀 climbing to a 22-week high, and 𝗗𝗮𝘁𝗮 𝗖𝗲𝗻𝘁𝗲𝗿 & 𝗔𝗜 𝗜𝗻𝗳𝗿𝗮𝘀𝘁𝗿𝘂𝗰𝘁𝘂𝗿𝗲 𝗙𝘂𝗻𝗱𝘀 enjoyed a sixth straight inflow. There were few subgroups to post outflows, though 𝗠𝗲𝗺𝗼𝗿𝘆 & 𝗗𝗥𝗔𝗠 𝗘𝗧𝗙𝘀 saw record-setting outflows and Internet Funds their biggest since early July. It was also the 11th consecutive weekly inflow for 𝗖𝘆𝗯𝗲𝗿𝘀𝗲𝗰𝘂𝗿𝗶𝘁𝘆 𝗙𝘂𝗻𝗱𝘀, their longest streak since 1Q25, as investors embrace AI and cybersecurity in tandem, viewing them less and less as competing narratives.
For more read our Global Navigator: eu1.hubs.ly/H0zcZ2_0
Flows into EPFR-tracked funds had a late-July flavor during the latest reporting period, with several groups posting their largest inflows and outflows since the week ending July 29. Then, as now, escalating tensions in the Middle East and high energy prices were not enough to dent expectations that the US Federal Reserve would keep rates on hold at their next meeting or undermine investors’ faith in the artificial intelligence story. As was the case then, and remains true during the latest week ending October 14, flows into Technology Sector and US Equity Funds rebounded, Alternative Funds saw inflow streaks end and flows into Bond Funds were relatively subdued.
For more read our Global Navigator: eu1.hubs.ly/H0zb5b90

One of the most striking features of capital markets this year has been the resilience of issuance windows. Despite ongoing uncertainty around rates, geopolitics and growth expectations, investors have repeatedly stepped in to absorb new debt and equity supply.
Which raises an interesting question:
What's driving demand?
Our view is that we're spending a lot of time focusing on the price of money, and not enough time focusing on the flow of money. Globally domiciled and mandated Equity Funds have attracted $930bn of inflows YTD to Week ending 7th October, while Bond Funds alone drew $760bn of inflows over the same period, according to EPFR flows data. EPFR now captures flow data across $79.7 trillion of Assets, covering around 95% of the global Mutual Fund and ETF market.
Why does this matter for DCM and ECM?
Because fund flows ultimately become capital flows. When investment-grade bond funds experience sustained inflows, demand for new issuance increases. When passive equity vehicles receive persistent inflows, index constituents benefit from a structural source of demand that often has little to do with short-term fundamentals. The result is a widening gap between issuers positioned inside the path of global savings flows and those positioned outside it.
In many ways, today's cost of capital is being shaped not only by the price of money, but by the flow of money. The question for capital markets teams is simple: are we spending enough time analysing where capital is moving, or only where rates are moving?
Click in the comments section to learn more.

