

Turn economic complexity into clear insights & visuals. Research, data visualization & content for businesses, media & institutions. 🌐 https://xitter.cf/t.co/LBV0Esyo0E
Global
Joined June 2023
- Tweets4.1K
- Following670
- Followers11.2K
- Likes8.6K






Pinned Tweet
The Global Money Supply Monitor (#GMSM) aims to track, analyze, and monitor global money supply trends across economies, elucidating their relationship with the broader economy and financial markets.
Comprehensive coverage spanning 169 countries.
👇👇👇
econovis.net/global-money-su…

📈 U.S. Corporate Profit Growth Accelerates to 22.8% in Q2 2026
📊 Full analysis and 7 charts from Econovis ↓
econovis.substack.com/p/us-c…
U.S. corporate profit growth has historically been volatile, swinging between double-digit gains and sharp declines during downturns such as the dot-com bust, the 2008–09 Financial Crisis, and the 2020 pandemic. The current cycle stands out: after slowing in 2024 and the first half of 2025, profit growth accelerated to 22.8% in Q2 2026, among the strongest readings of the past two decades outside immediate post-recession rebounds. Unlike the sharp increases in 2009 and 2020, which followed steep profit collapses and were amplified by low-base effects, the latest acceleration is occurring at a record profit level. This suggests that the current surge is more than a mechanical rebound from a depressed base.
#USA #economy #corporate #profit #equity #finance #stocks #SPX #investing

📈 Real U.S. Corporate Profits Enter a New Growth Phase Amid the AI Boom
📊 Full analysis and 7 charts from Econovis ↓
econovis.substack.com/p/us-c…
Adjusted for inflation, U.S. corporate profits have grown at a 3.0% CAGR since 1950, but the long-term trend is marked by distinct periods of expansion and stagnation. A strong 1950–1966 expansion, with profits growing 4.4% annually, gave way to nearly two decades of stagnation from 1966–1992, when growth averaged just 0.6% amid the oil shocks, high inflation, and the Volcker-era recession. Profits then re-accelerated from 1992–2007, growing at a 5.5% CAGR, before the Financial Crisis ushered in another slower-growth period from 2007–2019, when profits grew 1.9% annually. Since 2019, growth has again averaged 5.5% annually, matching the 1992–2007 expansion but following a different path: an initial COVID-era surge of 8.8% CAGR from 2019–2021 was followed by renewed acceleration from 2024, with real profits growing 7.3% annually through Q2 2026 and reaching a record $4.8 trillion. The latest expansion has unfolded amid the technology and AI boom, alongside strong corporate investment and productivity gains, putting real U.S. corporate profits into another period of unusually strong growth.
#USA #economy #corporate #profit #equity #finance #stocks #SPX #investing

📈 U.S. Corporate Profits: A New Era of Record Growth
📊 Full analysis and 7 charts from Econovis ↓
econovis.substack.com/p/us-c…
U.S. corporate profits have entered a period of unusually strong growth, reaching a record $4.8 trillion in Q2 2026. The latest expansion stands out not only for its scale, but also for the breadth of the shift: profits are rising rapidly in real terms, reaching a record share of GDP, while the balance among major sectors continues to evolve. At the same time, profits remain relatively small compared with the value of the U.S. equity market, highlighting the widening gap between corporate earnings and market capitalization. Together, these trends provide a long-term view of how U.S. corporate profitability has evolved—from the manufacturing-led postwar economy to today’s more diversified, financially and technologically driven corporate landscape.
#USA #economy #corporate #profit #equity #finance #stocks #SPX #investing

Econovis retweeted
📈 Silver’s Boom-Bust Year: Down 54% From Its January Peak
Silver spot prices have fallen to $53.9 per ounce as of October 23, 2026, down 54% from the record $116.6 reached on January 28. Prices more than doubled in the 12 months to that peak, rising 138% from $48.9 on October 23, 2025, and nearly quadrupled from about $30 at the start of 2025.
The unwind has been choppy rather than a straight line, with rallies in February and May failing to reclaim the highs. The July 17 low of $56.0 has now been broken, taking silver to its lowest level since late 2025. Even so, the metal remains 10% above its price a year ago and roughly 80% above its January 2025 level.
#silver #gold #PreciousMetals #XAG #investing

Econovis retweeted
📈 Gold Falls Back Below $4,000, Down 26% From Its January Peak
Gold spot prices have dropped to $3,996 per ounce as of October 23, 2026, down 26% from the record $5,396 reached on January 29. The metal had climbed 31% in the three months to that peak, from $4,126 on October 23, 2025, and roughly 2.6x since the start of 2024.
The pullback has come in stages. A rebound to $4,601 on August 27 failed to hold, and prices have since slid 13% from that level back to the $4,000 mark. Gold is now 3% below its price a year ago, but remains nearly double its January 2024 level of about $2,050.
#gold #GoldPrices #PreciousMetals #bullion #XAUUSD #investing

📈 S&P 500 Market Capitalization Reaches $68.3 Trillion
The total market capitalization of the S&P 500 stood at $68.3 trillion on October 23, 2026, fluctuating around an average of $69 trillion since August. Since the start of the year, the index’s total market value has increased by $7.2 trillion, or 11.8%.
#equity #stocks #StockMarket #SPX #finance #investing #trading

📈 Silver’s Boom-Bust Year: Down 54% From Its January Peak
Silver spot prices have fallen to $53.9 per ounce as of October 23, 2026, down 54% from the record $116.6 reached on January 28. Prices more than doubled in the 12 months to that peak, rising 138% from $48.9 on October 23, 2025, and nearly quadrupled from about $30 at the start of 2025.
The unwind has been choppy rather than a straight line, with rallies in February and May failing to reclaim the highs. The July 17 low of $56.0 has now been broken, taking silver to its lowest level since late 2025. Even so, the metal remains 10% above its price a year ago and roughly 80% above its January 2025 level.
#silver #gold #PreciousMetals #XAG #investing
📈 Gold Falls Back Below $4,000, Down 26% From Its January Peak
Gold spot prices have dropped to $3,996 per ounce as of October 23, 2026, down 26% from the record $5,396 reached on January 29. The metal had climbed 31% in the three months to that peak, from $4,126 on October 23, 2025, and roughly 2.6x since the start of 2024.
The pullback has come in stages. A rebound to $4,601 on August 27 failed to hold, and prices have since slid 13% from that level back to the $4,000 mark. Gold is now 3% below its price a year ago, but remains nearly double its January 2024 level of about $2,050.
#gold #GoldPrices #PreciousMetals #bullion #XAUUSD #investing
📈 China’s Iran-Linked Oil Imports Plunge Amid War and Hormuz Disruption
📊 Full analysis and 6 charts from Econovis ↓
econovis.substack.com/p/pers…
China’s crude oil imports recorded as originating from Malaysia and Indonesia—widely believed to include substantial volumes of Iranian crude whose origin is obscured to circumvent sanctions—have risen sharply since 2015. Flows accelerated from 2022 onward, averaging 1.55 million barrels per day (mb/d) in 2025 before reaching a record 2.5 mb/d in March 2026.
The surge proved short-lived. Following the outbreak of war and disruptions around the Strait of Hormuz, imports fell to just 0.92 mb/d in June, recovered partially to 1.33 mb/d in August, then dropped to 0.69 mb/d in September. These sharp swings contrast with the more sustained buildup from 2022 to 2025, highlighting the growing volatility of Iran-linked oil flows amid regional conflict, sanctions enforcement, and shipping disruptions.
#China #Russia #SaudiArabia #energy #fuels #oil #crude #CrudeOil #OOTT #Iran #sanctions #HormuzStrait #Hormuz

📈 China’s Crude Oil Imports Plunge, Then Partially Recover
📊 Full analysis and 6 charts from Econovis ↓
econovis.substack.com/p/pers…
China’s crude oil imports peaked at 13.1 million barrels per day (mb/d) in December 2025, the highest level in the 18-month period, and averaged 11.4 mb/d for the year. Imports then fell for six consecutive months, hitting a low of 7.1 mb/d in June 2026—a 38% decline from 2025—before partially recovering to 8.5 mb/d in July and 8.9 mb/d in both August and September. September imports were up 26% from June but remained 22% below the 2025 average.
The decline was concentrated overwhelmingly in shipments from the Persian Gulf region. Imports from the region fell from 6.4 mb/d in February to just 2.1 mb/d in June, while flows from the rest of the world remained comparatively stable at around 4.6–5.2 mb/d, broadly in line with 2025 levels. This divergence suggests that disruptions to Persian Gulf supplies and sourcing played a major role in the spring decline, rather than a broad-based reduction in China’s oil imports. Potential contributing factors include war-related disruptions, sanctions, pricing conditions, and shifts in shipment schedules or contract timing.
#China #energy #fuels #oil #crude #CrudeOil #OOTT #Iran #sanctions #HormuzStrait #Hormuz

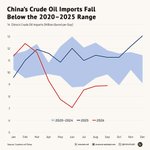
📈 China’s Crude Oil Imports Fall Below the 2020–2025 Range
📊 Full analysis and 6 charts from Econovis ↓
econovis.substack.com/p/pers…
China’s crude oil imports have remained well below their 2020–2025 historical range since April 2026. After starting the year at around 11–12 million barrels per day (mb/d), imports fell sharply from March, hitting a low of 7.1 mb/d in June—below the historical range. Volumes recovered modestly to 8.9 mb/d in both August and September but remained far below the 2025 average of 11.4 mb/d.
The sustained decline points to a significant shift in China’s crude oil import flows. Weaker demand may be one factor, but the scale of the shortfall could also reflect changes in supply availability, sourcing patterns, inventory management, and other market conditions. The weakness is particularly notable given the seasonal tendency for Chinese crude oil imports to strengthen in the second half of the year.
#China #energy #fuels #oil #crude #CrudeOil #OOTT #Iran #sanctions #HormuzStrait #Hormuz

📈 Persian Gulf Oil Shut-Ins Fall From 20% to 6% of Global Crude Exports
📊 Full analysis and 6 charts from Econovis ↓
econovis.substack.com/p/pers…
At their May 2026 peak, Persian Gulf crude oil production shut-ins were equivalent to 19.9% of global crude oil exports and 11.9% of world production—an extraordinary concentration of supply disruptions in a single region. By September, these shares had fallen to 6.2% of global exports and 3.7% of global production, declines of roughly 69% from their peaks.
Throughout the period, shut-ins accounted for a larger share of global exports than of production, reflecting the Persian Gulf’s outsized role in international oil trade. As a result, disruptions in the region can have a disproportionate impact on global oil markets. Although the decline in shut-ins points to a partial recovery in regional supply, the remaining disruptions in September still represented a significant share of global crude oil exports and production.
#Oil #Energy #CrudeOil #Crude #PersianGulf #HormuzStrait #Iran #SaudiArabia #UAE #USA #China #Geopolitics

📈 Persian Gulf Oil Shut-Ins Fall 69% as Iran Diverges From Regional Recovery
📊 Full analysis and 6 charts from Econovis ↓
econovis.substack.com/p/pers…
Persian Gulf crude oil production shut-ins relative to the 2025 average peaked at 8.9 million barrels per day (mb/d) in May 2026 before declining 69% to 2.7 mb/d in September. The recovery varied significantly across producers: combined shut-ins in Iraq, Kuwait, Oman, and Bahrain fell 83% from their May peak, while those in Saudi Arabia and the UAE declined 80%. Iran moved in the opposite direction, with shut-ins increasing 33% as the U.S. blockade effectively halted Iranian crude exports.
The divergence mirrors the broader recovery in Persian Gulf oil production. While most regional producers have restored output, Iran’s supply constraints have intensified, reflecting the disruption to its crude exports.
#Oil #Energy #CrudeOil #Crude #PersianGulf #HormuzStrait #Iran #SaudiArabia #UAE #USA #China #Geopolitics

📈 Persian Gulf Oil Output Remains 11% Below 2025 Average, With Iran Hit Hardest
📊 Full analysis and 6 charts from Econovis ↓
econovis.substack.com/p/pers…
Combined crude oil production across the six Persian Gulf producers plunged from 24.4 million barrels per day (mb/d) in February 2026 to 14.4 mb/d in May, a 41% decline in just three months. Output subsequently recovered to 19.1 mb/d in July, 19.5 mb/d in August, and 20.5 mb/d in September, but remained 11% below the 2025 average.
The impact varied sharply across producers. Iran recorded the steepest decline, with September output 40% below its 2025 average, followed by Kuwait (-29%) and Saudi Arabia (-16%). By contrast, the UAE and Oman were the only producers with output above their 2025 averages, at 24% and 21% higher, respectively.
Iranian crude production fell from an average of 3.3 mb/d in 2025 to 2.0 mb/d in September 2026, highlighting the disproportionate impact on Iran’s oil supply and its potential implications for crude exports.
#Oil #Energy #CrudeOil #Crude #PersianGulf #HormuzStrait #Iran #SaudiArabia #UAE #USA #China #Geopolitics

📈 China’s Goods Exports Top $4.4 Trillion as Total Trade Hits Record $7.5 Trillion
China’s total goods trade reached a record $7.5 trillion in the 12 months ending September 2026, as exports topped $4.4 trillion and imports hit a record $3.1 trillion. The resulting trade surplus widened to $1.2 trillion, highlighting China’s growing export strength and its dominant position in global merchandise trade.
#China #trade #exports #imports #TradeSurplus #surplus #TradeWar #tariffs

📈 S&P 500 Market Cap Holds Near $69 Trillion
The total market capitalization of the S&P 500 reached $68.5 trillion on October 16, 2026, remaining near $69 trillion since August. Since the start of the year, the market’s total value has increased by 12.1%, or $7.4 trillion.
#equity #stocks #StockMarket #SPX #finance #investing #trading

Econovis retweeted

Mapped: Where China Out-Trades the U.S. and EU (2000 vs. 2025) 🌐
visualcapitalist.com/mapped-…

📈 U.S. Trade Deficit Has Shifted From China to Other Global Partners
📊 Full analysis and 5 charts from Econovis ↓
econovis.substack.com/p/us-c…
The U.S. goods trade deficit has moved through oil shocks, the global financial crisis, and the pandemic, but its overall size has changed less than its geographic composition. Since the U.S.–China trade war began in 2018, China's share of the U.S. goods trade deficit has declined substantially, while the deficit with the rest of the world has widened.
Between Q3 2018 and Q2 2026, the U.S. goods trade deficit with China fell from 2.0% to 0.5% of GDP, while the deficit with the rest of the world increased from 2.2% to 2.8%. The divergence is consistent with a significant shift in U.S. sourcing toward other trading partners, including Vietnam, Mexico, and other manufacturing hubs, as companies adjusted supply chains amid tariffs and changing trade policies.
#USA #China #trade #exports #imports #economy #GDP #goods #TradeWar #tariffs #deficit #globalization

Econovis retweeted
Charted: The Three Waves of the U.S. Trade Deficit (1990–2026) 📉
visualcapitalist.com/three-w…

📈 U.S. Trade Deficit Realigns: China Down 61%, Rest of World Up 97% (2018–Q2 2026)
📊 Full analysis and 5 charts from Econovis ↓
econovis.substack.com/p/us-c…
The U.S.–China trade war coincided with a lasting shift in the composition of the U.S. trade deficit. In 2015, the deficits with China and the rest of the world were roughly equal and had moved broadly in tandem. After tariffs and trade restrictions were introduced in 2018, the two trends diverged sharply.
Between 2018 and Q2 2026, the total U.S. trade deficit increased 21%, from $870 billion to $1.05 trillion. Over the same period, the deficit with China fell 61%, from $420 billion to $165 billion, while the deficit with the rest of the world surged 97%, from $450 billion to $890 billion.
By Q2 2026, the U.S. trade deficit with the rest of the world was more than five times larger than the deficit with China, highlighting a major shift in the geographic composition of the U.S. trade deficit and the growing importance of alternative trading partners.
#USA #China #trade #exports #imports #economy #GDP #goods #TradeWar #tariffs #deficit #globalization
