

@VisualCap
Account based inCanada
About this account
- Account based in
- Canada
- Connected via
- Web
Account-level information from X, not a live location or the device used for a specific post.
Data-driven visual content focused on global trends, investing, technology, and the economy. 📲 Creator on @VoronoiApp
Vancouver, BC
Joined August 2011
- Tweets17.6K
- Following3.3K
- Followers366K
- Likes2.3K
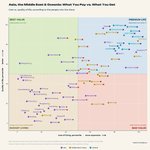



Ranked: 70 Cities in Asia and Oceania by Quality of Life vs. Cost 🌏
This graphic by Valerii Emelianov is one of the many incredible data-driven charts and stories from creators featured on our website. ✅
visualcapitalist.com/cp/rank…

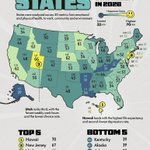
Mapped: America’s Happiest States in 2026 😊
visualcapitalist.com/mapped-…

Ranked: The World’s Most and Least Free Countries 🕊️
visualcapitalist.com/ranked-…

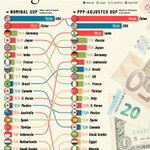
Ranked: The World’s Largest Economies in 2026 🌍
visualcapitalist.com/the-wor…

EMBA students saw average salaries rise 17.5% during their programs, while 40% earned a promotion 🎓
Created in partnership with the @hinrichfdn, this visualization explores the forces reshaping global leadership, the career benefits of an EMBA degree, and what executives should consider when choosing a program.
See the full infographic: visualcapitalist.com/sp/hf11… #hf11

Mapped: Europe’s Surging Migrant Population (2000–2024) 🌍
visualcapitalist.com/mapped-…

Marriage vs. Divorce Rates, by U.S. State 💍
visualcapitalist.com/marriag…

Ranked: Which Industries Have More Women Than Men? 👩
visualcapitalist.com/ranked-…

Eight of MLB’s 10 highest-payroll teams made the 2026 playoffs, yet the Mets, with the league’s highest payroll, missed out ⚾
Created in partnership with @TerzoHQ, this graphic ranks all 30 MLB teams by payroll and highlights which ones made the playoffs.
visualcapitalist.com/sp/ter0… #ter02
Ranked: The 100 Best Universities Outside the U.S. for 2027 🎓
visualcapitalist.com/best-un…

Ranked: Countries With the Most Nobel Prizes (2026) 🏅
visualcapitalist.com/ranked-…

Mapped: Youth Unemployment Rates Across Europe in 2026 💼
visualcapitalist.com/mapped-…

Mapped: The Male-to-Female Ratio in Every Country 👥
This graphic by Iswardi Ishak is one of the many incredible data-driven charts and stories from creators featured on our @VoronoiApp. ✅
voronoiapp.com/demographics/…

Ranked: The World’s Biggest Carbon Emitters 🌍
visualcapitalist.com/ranked-…

Ranked: America’s Biggest Farm Economies in 2025 🌾
visualcapitalist.com/ranked-…

Ranked: The Most Educated Countries in the World 🎓
visualcapitalist.com/most-ed…

U.S. gold IRA assets grew 38-fold over the past 20 years, rising from $2 billion in 2005 to $76 billion in 2025 🥇
Created in partnership with @USMoneyReserve, this graphic shows the estimated growth of gold and silver IRA assets over the past 20 years.
visualcapitalist.com/sp/usmr… #usmr01

Ranked: Countries That Owe the Most Money to the IMF 💰
visualcapitalist.com/countri…

Ranked: The World’s Best and Worst Cities for the Environment 🌱
visualcapitalist.com/ranked-…

Among disaster-affected people worldwide who received no warning, what share own a mobile phone?
17%About one-quarter
13%About one-fifth
25%About half
45%About three-quarters
103 votes • Final resultsExplore more World Risk Poll insights on disaster warnings and action: visualcapitalist.com/sp/lrf0…
