

Building practical farm apps and digital tools that make everyday work simpler for Australian broadacre growers.
Australia
Joined September 2026
- Tweets45
- Following58
- Followers7
- Likes17

Before buying farm software, ask for the exit door.
If you leave, can your paddock history, spray records and yield data leave with you—in a usable format?
A PDF to read is not the same as data you can reuse.
Choose the tool. Keep your options.
Setmagro Farmapps retweeted
Thanks for sharing, Julia. That's guiding our thinking too. We are currently using this top-10 (noting the infographic was created using AI based on our curated content).

AUSTRALIA’S 2026–27 BROADACRE PROFIT OUTLOOK: 73RD PERCENTILE.
But national averages hide the farm reality.
ABARES has:
• Victoria at the 83rd percentile
• WA at the 33rd percentile
• Central & South Wheat Belt WA at the 28th percentile
Same national outlook. Very different seasons.
The useful farm number is your region, not Australia’s average.
Source:
ABARES, Weekly Australian Climate, Water and Agricultural Update — 22 October 2026:
agriculture.gov.au/abares/pr…
The Australian Agricultural Drought Indicators combine forecast climate conditions and commodity prices with current farm characteristics. Percentiles compare projected 2026–27 broadacre farm profit with simulated outcomes over the past 33 years.
They are regional indicators, not forecasts for individual farms.
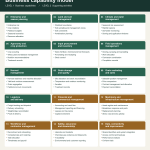
Australian grain growers: looking at this map, where do farm apps or technology fall short - missing features, systems that don’t connect, or no suitable app?
Reply with the capability number, the task and what you wish worked better. #GrainGrowers #AgTech

Your grain can be in six places. Can your records tell you where?
During harvest, tonnes move between paddocks, silos, trucks, receival sites and contracts.
How current is your true grain position?
0%Live or near-live
0%Updated daily
0%Every few days
100%Only clear after harvest
1 votes • Final results5 days to go before the survey ends. Please respond to be considered a part of a pilot group building smart digital solutions for the farmers, with the farmers.
ONE JOB. FOUR RECORDS.
The broadacre tech problem is not a lack of apps.
It is one paddock job being recorded in the monitor, farm app, compliance file and spreadsheet - because the systems do not talk to each other.
The next useful farm software will not ask for more data.
It will stop the same data being entered twice.
Setmagro Farmapps retweeted
Your grain can be in six places. Can your records tell you where?
During harvest, tonnes move between paddocks, silos, trucks, receival sites and contracts.
How current is your true grain position?
0%Live or near-live
0%Updated daily
0%Every few days
100%Only clear after harvest
1 votes • Final results🌾 The number hiding in today’s grain update: ZERO.
None of ABARES’ selected Australian grain export indicators is below a year ago:
APW +16%
ASW +15%
Sorghum +14%
Barley +6%
Canola +1%
FOB benchmarks, not farm-gate bids.
Source: ABARES Weekly Australian Climate, Water and Agricultural Update, 15 October 2026
agriculture.gov.au/abares/pr…
🌾 AUSTRALIA COULD SHIP 29 WHEAT VESSELS BEFORE THE NEW-CROP PIPELINE FILLS
Australia is forecast to export about 2.6Mt of grain this October, 47% above the five-year October average.
Around two-thirds is expected to be wheat:
2.6Mt × ⅔ = 1.73Mt wheat
At an illustrative 60,000t per bulk vessel, that is roughly 29 wheat cargoes in one month.
Dairy Australia reports that stronger-than-usual export demand has already reduced old-crop wheat availability as harvest approaches.
The overlooked signal:
This is not only an export-demand story. It is a stock-handover story.
Australia may enter harvest with less old-crop wheat competing against the new crop. That could support nearby supply, but it does not guarantee stronger harvest bids because new-crop volume, quality, storage, freight and local basis still matter.
Worth monitoring through harvest:
• Old-crop versus new-crop bid spreads
• Wheat vessels added to port schedules
• Export-terminal capacity
• Whether local basis holds as receivals accelerate
Global disruption is becoming physical Australian grain movement.
Sources:
news.bloombergtax.com/intern…
assets.dairyaustralia.com.au…

🌾A 3% WHEAT FALL THAT BECAME A 1% RISE
Over the past fortnight:
• CBOT wheat fell from US707c/bu to US686c/bu
• The Australian dollar weakened from about US$0.72 to US$0.69
Using the CME wheat conversion:
Two weeks ago:
US$7.07/bu = US$259.80/t
÷ 0.72 = A$360.80/t
Now:
US$6.86/bu = US$252.10/t
÷ 0.69 = A$365.40/t
So wheat fell 2.9% in US dollars, but rose about 1.3% when translated into Australian dollars.
That is the currency cushion.
It helps explain why a bearish move on Chicago does not always flow directly into Australian prices.
Of course, CBOT is not an Australian cash bid. Grade, basis, freight, port capacity and local demand still determine the price offered to growers.
But before interpreting an overseas futures move, convert it into A$/t.
The direction can change.
Sources:
GrainGrowers, 9 October 2026:
graingrowers.com.au/news/mar…
CME conversion guide:
cmegroup.com/trading/agricul…

🌾 NO FORWARD BUYING DOES NOT ALWAYS MEAN NO DEMAND
Asian wheat mills normally buy up to 6 months ahead.
Today, some are reportedly covered only through December, hoping high prices ease as Australia’s new crop becomes available.
That creates a hidden “demand shadow”:
• Current forward sales may look weak
• Import needs have not disappeared
• Buying may be compressed into Australia’s harvest and early-2027 shipping window
USDA forecasts Australia could export 24.5Mt of wheat in 2026/27.
At 60,000t per vessel, that is about 408 cargoes, averaging 34 each month.
If Asian buyers return together after delaying purchases, port capacity and execution may matter as much as total crop size.
Important caveat: delayed buying can support later demand, but weak consumption or cheaper competing origins could still reduce it.
Sources:
Asian buying coverage:
moneycontrol.com/world/asian…
USDA Australia:
fas.usda.gov/data/gain/2026/…

Australian barley’s biggest competitor in China may not be another exporter. It may be China’s own downgraded wheat and old-stock rice.
USDA’s latest China update says:
• Feed demand remains firm
• Rain-damaged wheat is moving into feed
• Old-stock rice is also being released for feed
• Corn imports are forecast at only 6Mt
• Australian barley remains a dominant imported feed grain
FAO adds another clue: it cut forecast global maize use by 4.6Mt, but that reduction was fully offset by higher use of barley, sorghum and wheat, mainly in feed rations.
The insight:
China can increase animal-feed production without increasing total grain imports. It can simply change the ration.
For Australian growers, the leading indicators are therefore not just Chinese livestock numbers.
Watch:
1. Chinese corn quality and price
2. Reserve wheat and rice auctions
3. Barley stocks at Chinese ports
4. Australian barley vessel nominations
Strong feed demand matters—but only the portion China cannot satisfy internally becomes import demand.
Sources:
USDA China Grain and Feed Update:
fas.usda.gov/data/gain/2026/…
FAO Cereal Brief:
fao.org/worldfoodsituation/c…
🌾 ONE OVERSEAS SHORTFALL → SEVEN SHIPS TO WATCH
Indonesia received only about 60,000t of Black Sea wheat in September, versus 500,000t a year earlier.
Missing volume: 440,000t
That is roughly seven 60,000t bulk wheat cargoes.
Asian buyers have already purchased at least 500,000t of Australian and Argentine wheat to replace delayed Black Sea supply.
But here is the useful test for Australian growers:
A demand headline only becomes physical Australian demand when vessels and export capacity are booked.
Under Australia’s new Bulk Wheat Code, port operators must keep publishing port loading statements.
Watch those shipping stems through harvest. If replacement demand is genuinely shifting to Australia, additional wheat vessel nominations should start appearing—not necessarily identified as Indonesian cargoes, but as increased physical export activity.
Which port should show the signal first in your view: Kwinana, Port Adelaide, Geelong or Newcastle?
Sources:
Reuters:
reuters.com/world/asia-pacif…
Australian Bulk Wheat Code:
legislation.gov.au/F2026L012…
🌾 ABARES PRICE CHECK | 1 OCT 2026
Global grain benchmarks fell this week:
• US wheat: US$334/t, down 3%
• US corn: US$226/t, down 4%
• Canadian rapeseed: US$612/t, down 2%
The AUD also fell 1% against the USD, from US$0.71 to US$0.70.
Australian grain export indicators were steadier:
• SA APW wheat: $430/t, flat for the week and 16% higher year-on-year
• SA ASW wheat: $421/t, flat and 15% higher year-on-year
• SA feed barley: $370/t, flat and 4% higher year-on-year
• WA canola: $799/t, down 1% and 1% higher year-on-year
• QLD sorghum: $441/t, flat and 7% higher year-on-year
These are FOB export indicators, not local bids. Freight, grade, protein, basis, delivery window and marketing decisions affect the farm-gate result.
Source: ABARES Weekly Commodity Price Update, 1 October 2026
agriculture.gov.au/abares/da…
🌾 Australia’s bulk wheat export rules change tomorrow.
From 1 October 2026, a streamlined Wheat Port Code applies nationally for 3 years while the industry moves toward self-regulation.
The useful part for growers: port operators must still publish shipping schedules, capacity-management procedures, standard terms and reference prices.
These disclosures provide a public window into export demand, capacity constraints and potential shipping congestion—useful context when assessing local bids and delivery options, but not a price forecast on their own.
Official source:
legislation.gov.au/F2026L012…
A thought from the 2026 grain numbers:
This may be less a “high input cost” year than a yield-cushion year.
Using IGC + ABARES + published fertiliser/fuel data, I built an experimental Grain Margin Pressure Index.
It suggests wheat margins may actually be holding up better in parts of SA/VIC because yield is cushioning higher input costs - while NSW/WA growers can face more pressure despite stronger wheat prices.
Canola looks tougher: the price lift has been small relative to the combined yield + input-cost squeeze.
But national/state averages only tell us so much.
Growers: does this match what you’re seeing?
What is having the biggest effect on your 2026 margin:
yield, fertiliser, diesel, grain price - or something I’m missing?
Even just crop + state + “better/worse than last year” would be useful.
Indicative analysis only - not farm-specific financial advice. Uses regional averages, export-price benchmarks and estimated seasonal input costs.