Pinned Tweet
$VOO S&P500 ETF may be following a mirror image foldback from its midpoint. After a range bound move into early January 2027, equal degrees of Venus-Mars Helio could point to a low by February 2027. Watching whether the timing holds. No advice.
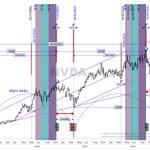
$NVDA Nvidia updated chart from my April 28th post, which forecast $244 and a drop to $200. Yesterday the market drove the stock below that point. It may now point to a lower low, a possible 4 month decline into February 2027, like November 2024 to April 2025. No advice.
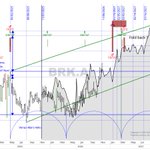
$BRK_A Berkshire Hathaway class A breaking out on an inverse mirror image foldback, similar to BRK.B? Investors may be fleeing to safety. It may take some time though. Next target $886K, March 2027? Invalidates below $813K. No advice.
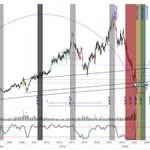
$GIS General Mills may be in oversold territory, a possible low on an almost 30-year cycle at a 4x1 timing line. The 1997 to 1998 period suggests a range bound move ahead of us. Watching the square of nine price levels for potential support or resistance. No advice.
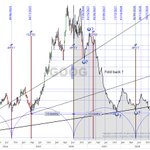
$GOOG Alphabet's mirror-image foldback does not look promising for the next few years. A break below $281, the 4x1 timing line, is bearish and opens the way to the 2x1 and 1x1 timing lines, a potential 15 month decline from the midpoint. Invalidates above $334. No advice.
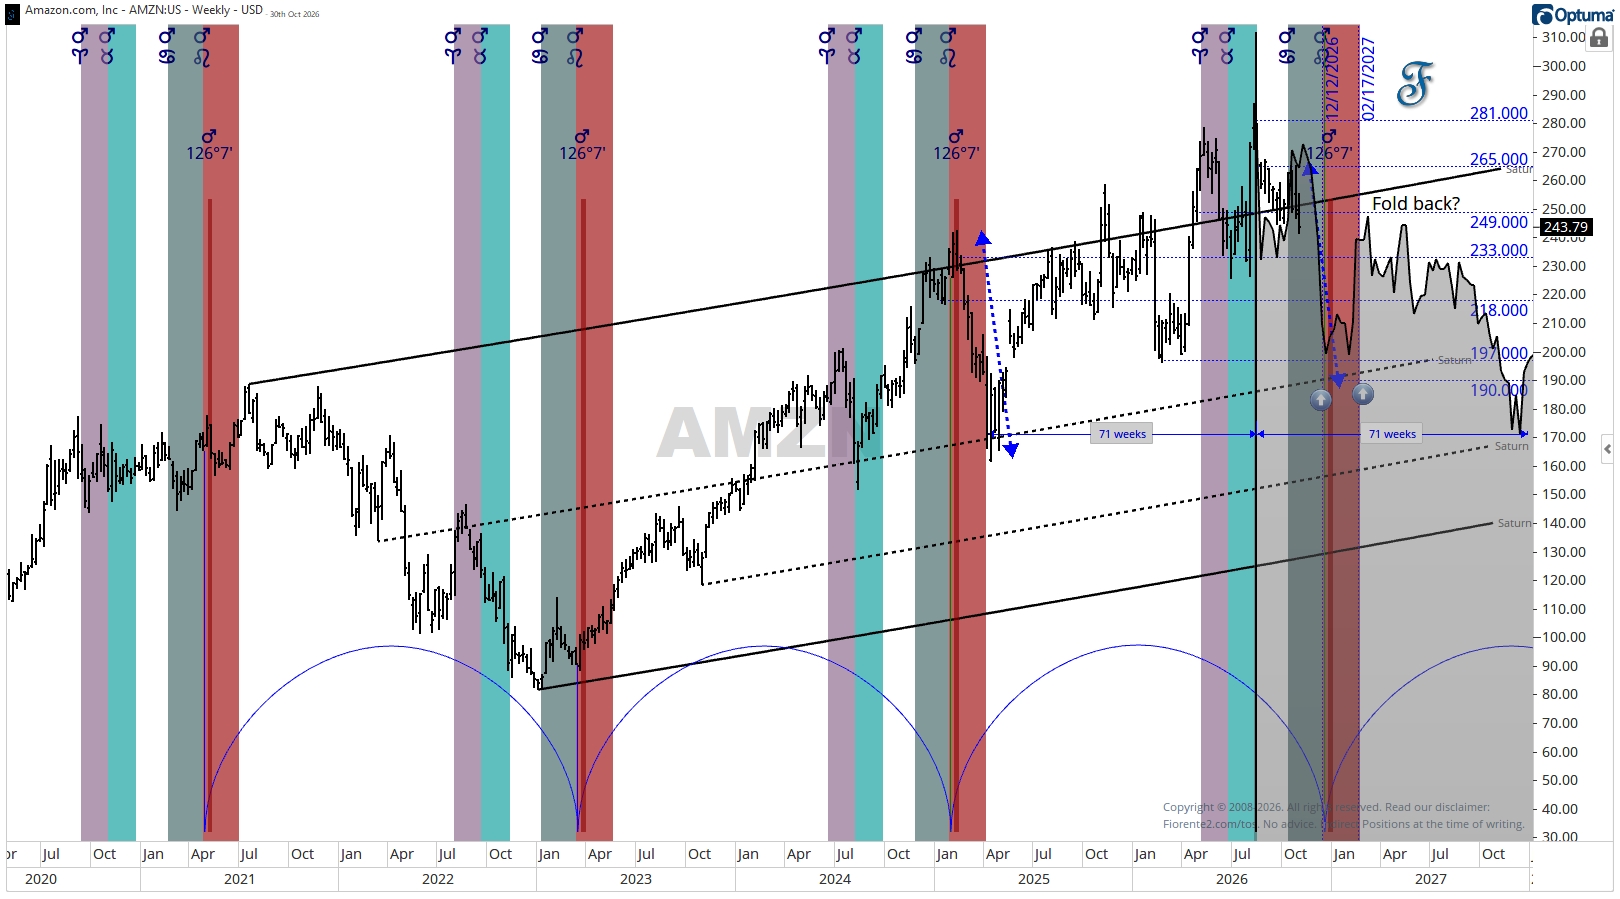
$AMZN Amazon folding back on a two year cycle? This near 22 month cycle might repeat and foldback from the August 2026 crest. Watching the Square of Nine price levels for possible support or resistance. A break above $265 may invalidate this scenario. No advice.
$JD JD.com @michaeljburry is betting on a recovery of this Hong Kong based retailer. It may take some time though when evaluating this 11.86 year cycle. JD is near a 12 year low, but a rebound could be temporary following the cycle, similar periods and the mirror image foldback. No advice.
$GC Gold Futures near a square out in price and time? Will gold fold back from here, or keep following the 1x1 Mars timing line to lower price levels in steps of $300? This is the third test of support at around $4000. A level often holds three times, but the fourth test tends to break. A break would point to $3700 next. Watching what happens next. No advice.
$ORCL Oracle folding back on the inverse behavior of the decans, as seen from the crest? It is still following the mirror image foldback on schedule, all the way back to where the uptrend started. Watching whether this keeps tracking the same timing. No advice.
$BRK_B Berkshire Hathaway breaking out on an inverse foldback? It may take some time though. The current price level around $541 is opposite the start of the rectangle at $411, which could act as a resistance area. Next target $589, March 2027? No advice.
$SI J.P. Morgan has cut its silver forecast to $63 on weaker solar demand, and at $53.95 the fundamentals point lower. Silver is still only approaching its larger 6- and 18-year cycle lows, so the decline could run toward 2027. A weekly close back above the $58.73 timing line would be the first hint a low is already in. The full chart walk is in today’s post.
Thx Olga, but your W.D. Gann photo as been altered by AI. This is the original found by me on the internet. Source: see the alt description
$HRL Hormel Foods may be close to an 18 year cycle low around $16 to $17. A rebound to AVWAP at $24 could be possible. Perhaps a bear trap , as fundamental value may be much lower at $9.61. That's 15.5x forward PE and the 1x2 timing line from the zero point crest, at a 18.6 year cycle low. No advice
$IWM Similar time periods, opposite responses? 📊 Sentiment flipped polarity over 1 year, from the August 2025 low to the August 2026 high. IWM may be following last year's A-B-C measured moves in reverse. A seasonal pullback could come first, and the longer-term downtrend may still be in play after that. No advice.
$IWM I wonder, Ryan; similar time periods may have opposite responses. A polarity shift in sentiment over 1 year, from a low in August 2025 to a high in August 2026, may still favor a longer-term downtrend after a seasonal pullback, following an inverse path as seen last year in A-B-C measured moves. No advice.
$NKE, named after the Greek Goddess of victory, may be close to a cycle low following the almost 12 year Jupiter cycle.
Saturn timing lines show possible support/resistance at $29-$35, right at 1791 days or 1791 solar degrees from the November 2021 high at $179.10.
Slow Stochastic shows it may be oversold for now. A rebound could be temporary, after which the downtrend may continue into 2032-2033, two Jupiter cycles from the March 2009 low. No advice.
#Copper is ruled by Venus in Western astrology, Mars in Vedic systems, and sometimes the Sun is used as secondary ruler. With demand high and supply limited, watching Jupiter (rules supply) as it passes through Mars, Venus, and Sun Decans. The Hi-Lo-Hi pattern suggests we may not have seen the high yet. No advice. @AstroGann33 @PropertySharem1
Tony, I wonder if the top has been set. $TLT displaced 78 months, whereas the Nasdaq Composite shows an 82% probability that the Nasdaq continues higher through year-end. Analogs can invert or fail, though. Watching whether your 2222-day displacement or my 78-month analog plays out. No advice.
You’re unable to view this Post because this account owner limits who can view their Posts. Learn more