

A service of @GSU_Library's Research & Data Services Team - promoting #dataliteracy for the public good & preparing students for data-related careers
- Tweets376
- Following259
- Followers160
- Likes120




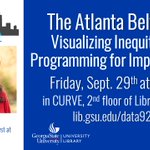




ALT A flyer with a head shot of Layla Bellows, a Community Data Analystis at Atlanta BeltLine, Inc., she appears to be outside and has long brown hair and is wearing a red blouse. Layla Bellows is the special guest for the next Data in the ATL, titled, The Atlanta BeltLine: Visualizing Inequities & Programming for Improvement this Friday, September 29th at 11 am in CURVE, 2nd floor of library South. The flyer also includes the Georgia State University Library Logo, a QR code for the event info, and a website lib.gsu.edu/data929


ALT Spoof of the Ghostbusters poster with the caption "How you gonna skew?"

ALT View of three different graphs - two 'paranormal' and one 'normal' which looks like a normal bell curve. Caption reads: "Skew is the degree that data deviates from symmetry. Skew can affect a distribution in several ways." The first paranormal graph with larger values to the left shows positive skew. Another graph with greater values to the right shows negative skew. A normal graph with a bell curve has Symmetrical (Null) distribution.

ALT The caption "Explore more tools and tips in the Data Science Resource Repository" and url www.nebigdatahub.org/dsrr. Captions are positioned inside ESP testing cards showing a square, a circle, and waves.

ALT Info about "The Summer of Data Blockbuster Double Features" series from the NEBDHub. You can learn more and explore data science with the NEBDHub at https://nebigdatahub.org/.

ALT Spoof of the ET poster with a child and alien hands touching in front of a moon and the caption "ETL: The Extract-Transform and Load"

ALT A page covered with Reese's Pieces and the caption "Extra data from different data sources; Transform raw data into processed data; Load data into the intended warehouse. ETL makes our lives easier by arranging data in a consolidated way, allowing for better automation, analysis accuracy, and managment."

ALT A phone over an alien flying saucer with the caption: "Phone home to the Data Science Resource Repository to find more tools and tips! https://nebigdatahub.org/dsrr/"

ALT A film reel over a starry sky. The NEBDHub logo precedes a caption which reads: "The Summer of Data Blockbuster Double Features: Learn and explore data science with the NEBDHub, https://nebigdatahub.org/. Coming to social platforms near you July 2023"

ALT Spoof on the Barbie characters meme for the 2023 Barbie movie. Image of Barbie as an astronomer with the caption: "This data scientist is an astronomer. Data!" with the link: https://bit.ly/IWannaStudyTheStars

ALT Spoof on the Barbie characters meme for the 2023 Barbie movie. Image of Barbie as an oceanographer with the caption: "This data scientist is an medical researcher. Data!" with the link: https://bit.ly/IWannaStudyTheOcean

ALT Spoof on the Barbie characters meme for the 2023 Barbie movie. Image of Ken as a medical researcher with the caption: "This data scientist is an medical researcher. Data!" with the link: https://bit.ly/IWannaStudyHealth

ALT Spoof on the Barbie characters meme for the 2023 Barbie movie. Image of Barbie as a financial analyst with the caption: "This data scientist is a financial analyst. Data!" with the link: https://bit.ly/IWannaStudyTheEconomy

ALT Parody of the Jaws poster with an upside down ice cream cone replacing a shark who surges to the surface with teeth bared at an unsuspecting swimmer. Caption reads: "You're gonna need a broader scope."

ALT Graph whose header proclaims: "Correlation is not causation!". This shows that although shark incidents and ice cream sales peak in July and August, they are not necessarily related.

ALT A graphic of a sandy beach with a reminder that you can find more tools and tips for learning statistics and data science at https://nebigdatahub.org/dsrr

ALT Poster for the "Summer of Data Blockbuster Double Features" series from the NEBDHub. You can learn and explore data science with the NEBDHub at https://nebigdatahib.org. More posts coming throughout July 2023!


