

Lascaux vintage crayon scrawls from a recalcitrant chart-crime recidivist publicly chronicling the incessant bickering between irrational inner voices.
San Francisco, CA
Joined February 2019
- Tweets1.2K
- Following187
- Followers9K
- Likes5.9K





Pinned Tweet
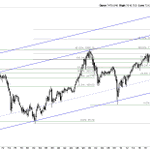
$SPX:GDP (Quarterly) 1946-2026: Every fibonacci target off of the 1983 all-time low just hit in Q2/Q3 2026...aka right now. Is it going to keep going to the upper channel line or reverse here at the internal rail? (Spoiler: Goodnight, Sweet Prince)

Gregorian Charts retweeted
$SPX (Quarterly): Straight from the Things That Make You Go Hmm file: The Fibonacci Time Zone projection from the Great Depression Q2 1932 all-time low lands on Q3 in 2026...aka right now. Probably nothing, right? Right?

Gregorian Charts retweeted
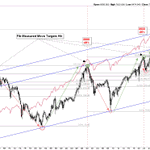
$SPX:M2 (Quarterly 1958-2026): The SPX:M2 ratio just double topped at the fib measured-move target off the 1961 high to the 1982 low. The first hit was the dot-com crash in Y2K - but this the first time SPX and M2 are converging at the ratio and the 161.8 fib target at the same point in time. Frame this and thank me in a couple years. You`re welcome in advance.

Gregorian Charts retweeted
$SPX:GDP (Quarterly) 1946-2026: Every fibonacci target off of the 1983 all-time low just hit in Q2/Q3 2026...aka right now. Is it going to keep going to the upper channel line or reverse here at the internal rail? (Spoiler: Goodnight, Sweet Prince)
$SPX:M2 (Quarterly 1958-2026): The SPX:M2 ratio just double topped at the fib measured-move target off the 1961 high to the 1982 low. The first hit was the dot-com crash in Y2K - but this the first time SPX and M2 are converging at the ratio and the 161.8 fib target at the same point in time. Frame this and thank me in a couple years. You`re welcome in advance.
$SPX (Quarterly): Straight from the Things That Make You Go Hmm file: The Fibonacci Time Zone projection from the Great Depression Q2 1932 all-time low lands on Q3 in 2026...aka right now. Probably nothing, right? Right?
Gregorian Charts retweeted
SPX:GDP (Quarterly): Buffet's favorite macro indicator, the SPX:GDP ratio just hit its measured-move target - The last 5 times this happened since GDP began being reported in 1947, each time decline in SPX followed by imminent declines, ranging from 15-49%. Above here goes to Oz

Gregorian Charts retweeted
6/27/26 SPX:M2 (1958-2026): The SPX:M2 ratio just tagged its 161.8 fib measured-move target again for a double-top (1st hit in Y2k). See '08 for the last convergence(!), but this is the first time all 3 are converging at the ratio's 161.8 target at the same time. Interesting, no?

Gregorian Charts retweeted
6/27/26 DJIA:GDP: With this week's new DJIA ath, the DJIA:GDP Ratio finally hit its 161.8 fib measured move target from the 1999 dotcom peak to the 2009 financial crisis low. The 161.8 target's convergence with Buffett's favorite indicator in his danger zone is interesting, no?

6/27/26 DJIA:GDP: With this week's new DJIA ath, the DJIA:GDP Ratio finally hit its 161.8 fib measured move target from the 1999 dotcom peak to the 2009 financial crisis low. The 161.8 target's convergence with Buffett's favorite indicator in his danger zone is interesting, no?
6/27/26 SPX:M2 (1958-2026): The SPX:M2 ratio just tagged its 161.8 fib measured-move target again for a double-top (1st hit in Y2k). See '08 for the last convergence(!), but this is the first time all 3 are converging at the ratio's 161.8 target at the same time. Interesting, no?
SPX:GDP (Quarterly): Buffet's favorite macro indicator, the SPX:GDP ratio just hit its measured-move target - The last 5 times this happened since GDP began being reported in 1947, each time decline in SPX followed by imminent declines, ranging from 15-49%. Above here goes to Oz
Gregorian Charts retweeted
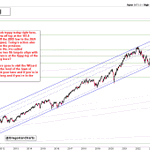
$SOX (Weekly): Semis look toppy right here, finally hitting their long-term blow-off top at the 161.8 fibonacci target, which comes off the 2009 low to the 2024 high (before the DeepSeekopalypse). Today's action also also hit the 2026 161.8 target from the previous high/low...Coincidence? (Spoiler: No, it's called convergence). Additionally, those two fib targets align with tagging massive overhead resistance at the tippy-top of the 10yr old bull-channel. You buying here?
Wherever you stand, north of here goes to visit the Wizard of Oz, while south of here visits the land of the laws of physics and the universe...so pick your lane and if you're in the former camp, go leveraged long and if you're in the latter, run Forest, run.

Gregorian Charts retweeted
$BTC (Weekly): Today`s action saw BTC hit up against the overhead descending channel resistance while simultaneously backtesting the 100% fib from the March 2025 low to the October 2025 ATH...not surprisingly, it reversed. There`s still strong support below at the rising support, so I`d be watching for a fight here over the next week or two while a wedge forms. Downside target is ~42-44k depending on the chart I look at while a breakout here could bring a retest of 100k and even an ATH. Gravity seems to be the path it`s on until proven otherwise.

$BTC (Weekly): Today`s action saw BTC hit up against the overhead descending channel resistance while simultaneously backtesting the 100% fib from the March 2025 low to the October 2025 ATH...not surprisingly, it reversed. There`s still strong support below at the rising support, so I`d be watching for a fight here over the next week or two while a wedge forms. Downside target is ~42-44k depending on the chart I look at while a breakout here could bring a retest of 100k and even an ATH. Gravity seems to be the path it`s on until proven otherwise.
$SOX (Weekly): Semis look toppy right here, finally hitting their long-term blow-off top at the 161.8 fibonacci target, which comes off the 2009 low to the 2024 high (before the DeepSeekopalypse). Today's action also also hit the 2026 161.8 target from the previous high/low...Coincidence? (Spoiler: No, it's called convergence). Additionally, those two fib targets align with tagging massive overhead resistance at the tippy-top of the 10yr old bull-channel. You buying here?
Wherever you stand, north of here goes to visit the Wizard of Oz, while south of here visits the land of the laws of physics and the universe...so pick your lane and if you're in the former camp, go leveraged long and if you're in the latter, run Forest, run.


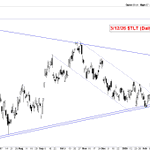
3/11/26 UST 30y Yield (Weekly): Today's action retraced to the 23.6% fib at stealth resistance (dashed line). It still has room to move up to keep the rates-go-lower thesis intact as long as the strong descending overhead resistance just above here which comes off the `23 high which should provide an emphatic rejection if it is indeed legitimate - if not, a closing candle on Friday above that resistance starts getting rather messy and wheels likely come off everything aside from the treasury short-end and $USD. Targets unchanged from the 1/24/26 note: Target 1: 4.43%, Target 2: 3.95%,
and Target 3: 3.25%
$TYX $TLT
