

Trader in Helsinki 🇫🇮 | US stocks & indices | Daily charts | Wave counts + momentum setups | The level that kills the idea is in the chart | Not advice
Helsinki, Finland
Joined October 2018
- Tweets2.3K
- Following94
- Followers27K
- Likes829


Pinned Tweet
$QQQ and $SPX look like the correction is done or very close. QQQ's wave 4 likely bottomed near 650, and S&P futures held the 0.786 at 7,374 right on the 200 EMA.
I'd expect one more shallow dip (QQQ mid 660s, ES around 7,500) and then the next leg up. Alt for QQQ is a deeper retest near 635.
ES back under 7,232 and I'm wrong.


A hold that reads like a hike. classic Fed.
$SPY has been jumpy all week, so nobody gets to act surprised now.
teapaw.org/DeItaone/status/212312…

FED MINUTES SIGNAL FURTHER RATE HIKES, WITH 50-BASIS-POINT MOVE ON THE TABLE
Nearly all Federal Reserve officials judged additional rate hikes likely appropriate, according to minutes of the October 27–28 FOMC meeting.
While most supported holding rates steady in October, some favored an immediate 25-basis-point increase.
A couple of policymakers said a hike larger than 25 basis points in December could be warranted if inflation data deteriorated.
Officials also warned that persistent inflation may require more restrictive monetary policy.
The Fed discussed AI investment, productivity and financial stability, underscoring risks surrounding the economic outlook.
2
2,187
$AVGO is moving with the rest of the chips after $NVDA's numbers.
I think wave 2 already ended earlier this month, right inside the fib box of the whole wave 1 rally. the first bounce ran straight into the downtrend line and the 200 day, and got pushed back.
A higher low around 330 to 320, then a clean break of that line, is what starts wave 3. Below 289.77 and I'm wrong.

$TGT crushed the quarter this morning and raised the full year guide again.
Chart wise, wave 4 looks done in late October, and the push out of the downtrend line was wave (i) of 5. this pullback is wave (ii), and the 0.5 to 0.618 zone around 156 to 154 is where I'd expect it to finish.
Hold that zone and wave 5 should take out the August high. Below the October low and the count is wrong.

2
2,162
The print was strong, and $NVDA is still sitting in the zone we marked here.
That's the part a lot of people will skip past. a beat can land inside a wave two area and still leave the work unfinished.
The next tell is whether price can leave this area, not whether the numbers were good enough.

$NVDA reports tonight, and I think this drop is only wave two.
Weekly, wave one topped in October out of a wedge. Daily, that last leg was an ending diagonal. it broke fast, and price is already in the fib zone between 165 and 146.50.
If that's wave two, what comes next is usually the longest wave. tonight decides how fast it starts.
2
5
4,066
Before we argue about waves, let's agree on what they say.
Markets run on their own rhythm, the shapes come back without a schedule, they're what a crowd leaves behind, and knowing where I stand in the shape tells me what's likely next and where I'm wrong.
What I don't get: certainty, a readable chart in every market, or a reason why. So to me it's a principle, a shape I can test on any chart.
Tonight was supposed to settle the AI demand debate, and the numbers did their part.
The market still looks unconvinced. maybe that's fair until the call is over, but the idea that the buildout just stopped looks a lot weaker now.
The other chip names will tell us if this is a real reset or just a one stock bounce.
1
2
2,344
$NVDA reports tonight, and I think this drop is only wave two.
Weekly, wave one topped in October out of a wedge. Daily, that last leg was an ending diagonal. it broke fast, and price is already in the fib zone between 165 and 146.50.
If that's wave two, what comes next is usually the longest wave. tonight decides how fast it starts.
$NVDA beat on everything and raised the guide, and after hours it's only up a couple percent.
That's the kind of reaction you get when a stock is still working through a correction. price is sitting inside my wave two zone, nowhere near leaving it yet.
Call is at midnight. the margin guide is the part I'd watch.
teapaw.org/DeItaone/status/212280…
$NVDA - Q3: EPS & REVENUE BEAT, Q4 REVENUE GUIDANCE ABOVE ESTIMATES
Results
🔸 Adj. EPS: $2.68 vs. $2.48 est. (+8.1% beat).
🔸 Revenue: $115.8B vs. $109.33B est. (+5.9% beat).
🔸 Adj. Gross Margin: 74.9%.
🔸 Data Center Revenue: $107.6B vs. $101.87B est. (+5.6% beat).
🔸 Net Income: $65.3B.
Guidance
🔸 Q4 Revenue: $130B vs. $125.21B est. (+3.8% above consensus).
$MU got hit hard again today, after yesterday's drop. now in the high 680s after a flush into the mid 660s.
This is still the wave 2 pullback after a w x y wave 4 ended at 650. Hold 650 and wave 5 should take out the June high.
Lose 650 and the count is wrong.

1
10
3,657
Same industry, opposite charts. $DIS just beat earnings and sits near its highs, $NFLX just printed a new yearly low.
Disney broke out of the box around 110 and I count the start of a third wave. a pullback into that box is fine, under 101.15 it isn't.
Netflix I count in the last leg of a bigger wave two. any bounce here looks like a (b) to me, and the 0.786 near 41.49 is where I think it ends.


4
2,700
302 in June, 40.59 on Nov 5. $SOXL holders know exactly how that felt.
I count the whole drop as w x y. (w) at 91.50, (x) at 169.83, (y) at 40.59. The bounce stalled at 69.73, and with Asian chips dumping and NVDA reporting tomorrow it's back near 51. The 0.618 is 51.72 and the 0.786 is 46.83. That pocket is where I'd want this low to form.
Lose 40.59 and I'm wrong. Hold it, and the first magnet is the 200 EMA up at 113.55.

$SPCX caught a Starship with the tower on Saturday. The chart was getting interesting before that.
From the 225.64 IPO high it fell in three waves to 104.83 in August. Then five waves up to 176.42, which I count as (i). The drop to 120.39 on Nov 5 looks like (ii), and now it's chopping around 139 under the falling line from the (i) top.
One more dip into 131 to 134 wouldn't bother me. A break of that line starts (iii), and my arrow is aimed over 200. Under 120.39 I'm wrong.

Nasdaq can't sit still this month. big red day, big green day, repeat
$QQQ is in the mid 660s now, right where sunday's map had the dip. not fun to sit through, but nothing on my chart is broken yet
teapaw.org/KobeissiLetter/status/…

BREAKING: The Nasdaq 100 has recorded an average daily swing of 2.4% so far in November, putting it on track for its most volatile month since April 2025.
This metric has more than doubled from 1.0% in September.
This also puts the Nasdaq 100 on track for its 2nd-most volatile month in at least 2 years.
The Nasdaq 100 has also closed up or down more than 1% in half of its trading sessions in November so far.
Meanwhile, the S&P 500 has recorded an average daily swing of 1.6% so far this month, also making November its most volatile month since April 2025.
By comparison, this figure did not exceed 1.0% in any of the previous 4 months.
Volatility is back in full swing.

1
6
3,075
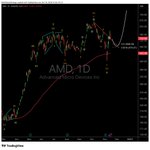
Nov 6 I asked $AMD for two things. Hold the 200 EMA, then break the trend line. It did both, and ran from a 449 close to 594 by Thursday.
Now it's giving some back. Around 500 this morning, right on the 0.5 at 498, with the 0.618 at 475 and the broken trend line coming in just under. That's where I want this retest to finish. Wave 4 already ended at 402 as a w x y, so next up is wave 5, and my arrow points past 720.
Under 402.10 the count is dead.

$AMD is still trying to hold the 200 EMA.
If we get a trend break from here, a new attack out of this complex correction is on the table. Under that average I wouldn't trust it yet.

Big earnings week ahead.
Drop a ticker below and I'll chart the cleanest setups over the next few days.
Quick $BTC update on yesterday's map.
Invalidation tightened to $81.2K, the wave (2) high. Still looking at the high 40s for C.

bitcoin:native lost the weekly average, and the B wave looks done near $87K.
If that's right, C is just getting started. My map points to the $45-48K area before the next real bottom.
Above the B high, I'm wrong. Until then, bounces are for selling, not for marrying.
#BTCUSDT

Shareholders, employees and Musk all want Jensen back. The board hasn't said a word yet.
My $NVDA chart already looks like wave (2) is done near 146. If the return headline actually lands, wave (3) won't wait for Tuesday's print.
2
8
2,824
$PANW reports Wednesday. Price is sitting on the old wave 4 zone, $300-315, with the 200 EMA right under it.
I read the pullback as an ABC that's nearly done. One last C dip into that box, then a move toward $440+.
A daily close well under $300 and I'm wrong.

1
2,641