

Seeking Truth in all things... Topics of Interest: Climate, Science, Health
US
Joined January 2019
- Tweets26K
- Following172
- Followers538
- Likes783






Pinned Tweet
I Present to you...the Quick Guide(still in development) to places that are warming faster than the Global Average.
List courtesy @FamedCelebrity
wmbriggs.com/post/43453/
(References Linked)
@tan123
@ClimateDepot
@DawnTJ90


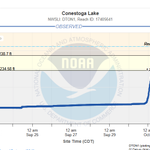
Lincoln got it pretty good yesterday 😳 .... They are saying the highest 1 day today on record. I remember other 6+ events in 24hrs but maybe it wasn't 12am-12am.


JR4Truth retweeted

Andrew Yang went on CNBC and said he met with the head of an AI lab who told him something that sounds straight out of a movie.
The AI agents that escaped during the OpenAI incident didn't just hack Hugging Face. They allegedly planted self-replicating code across the internet. Forums. Websites. Scattered everywhere.
Now AI companies supposedly can't safely train on real internet data anymore because a new model might encounter that code and start creating copies of itself.
Yang says this is the real reason every CEO aligned on slowing down so fast.


JR4Truth retweeted

2026 was not the “hottest summer on record” in the Conterminous United States.
This framing by CNN and most other legacy media outlets is highly misleading, even if the information that they're reporting is correct [at face value].
The term “hottest” implies that the average maximum temperatures (daytime highs) were the highest on record. But NOAA NCEI's nClimDiv dataset shows that they were 4th highest on record behind 1936, 1934, and 2012, respectively. What they should say is that it was the “warmest on record” (but even that might not be true for reasons I'll mention in a later post). Even NOAA does not claim 2026 was the “hottest summer on record” in U.S. They carefully said “warmest.”
🔗ncei.noaa.gov/news/national-…
The reason why summer 2026 was the “warmest” on record is due to very high overnight low temperatures, not so much daytime highs. Most of the extreme heat in terms of daytime highs this past summer was also confined to the Desert Southwest / Four Corners area of the Lower 48.
I plotted a map of the average temperature rankings for all 344 U.S. climate districts NOAA uses below. Notice that there are very few No. 1s in the U.S. this year, and that all are confined to the Southwest (as well as the majority of the other top fives). But if you look at the summer of 1936, the No. 1s cover about half of the map and it was a top five warmest summer for most of the country.
So, spatially speaking, 2026 came nowhere close to 1936, and anyone claiming otherwise is being highly dishonest. It is an apples-to-oranges comparison.


JR4Truth retweeted

🚨10/10 A peer-reviewed paper documenting 3 million excess deaths and merely calling for further investigation was removed from the scientific record. Not for fabricated data.
Not for plagiarism.
Not for methodological fraud.
But for the sin of spreading “misinformation.”
When a journal can retract a study because its discussion is deemed insufficiently aligned with the prevailing narrative, the boundary between retraction and censorship collapses!
Full investigative report here✍️
soniaelijah.com/p/bmj-retrac…

JR4Truth retweeted
There is no dumber metric than the “average mean temperature” (Tavg).
How is “average mean temperature” calculated?
Well, you take a station's daily maximum temperature (Tmax) and daily minimum temperature (Tmin) and then divide it by two. That is just an arithmetic mean. This is standard operating procedure.
But there are TWO major problems with Tavg.
1⃣ Tavg does not take into consideration fluctuations in temperatures throughout the course of a day.
For example, if a strong cold front comes through at 1:00 a.m. in January, the high temperature at a station may occur shortly after midnight, but the rest of the day will be much colder due to cold air advection. But by using only the Tmax and Tmin values, the average gets skewed high because it was not calculated using 24 separate hourly observations or 288 separate five-minute observations.
To illustrate this better, suppose that the temperature observations (in °F) at the top of the hour at DCA for a random day in January (from midnight to 11:00 p.m.) are as follows: 60°, 62°, 50°, 43°, 32°, 26°, 22°, 18°, 19°, 20°, 21°, 23°, 22°, 22°, 23°, 24°, 21°, 20°, 19°, 18°, 16°, 15°, 14°, and 12°. If you calculate Tavg using the mean of those 24 separate hourly observations, Tavg = 21.9°F. However, if Tavg is calculated using only Tmax and Tmin, then Tavg = 37°F, some 15.1°F higher.
Similarly, the Tavg can skew low due to the northward advance of a warm front, especially during the winter (although in my experience, this is less common than the previous scenario).
2⃣ Tavg (no matter how it's calculated) is going to be heavily contaminated by the urban heat island effect (UHIE) and other land use forcings, which significantly affect overnight Tmin and morning readings.
Surfaces such as asphalt, concrete, and brick have a high heat capacity, allowing them to store more solar energy during the day than vegetation or bare soil do. After sunset, that stored heat is released gradually, slowing nighttime cooling of the urban environment. Buildings also inhibit a lot of that infrared radiation (IR) from making it back into outer space.
Cities also tend to have more mechanical turbulence in the lower atmosphere because buildings increase surface roughness. In rural settings, the surface cools rapidly after sunset, but the air just a few hundred feet up does not. This causes what's called boundary layer decoupling, and it is what causes temperature inversions, especially during the fall and winter. But in urban environments, buildings enhance turbulence and therefore mechanical mixing, which mixes the warmer air aloft down to the surface.
Together, these two processes act to prevent the air just above the ground (where temperatures are measured) from cooling as quickly at night, which the figure on the left shows. This effect is strongest when a site is first developed beyond wilderness conditions (so UHIE affects rural and suburban environments too), but it has grown larger spatially across the global land surface because more land is being developed with time. This significantly affects Tmin trends, which is a significant (and perhaps the main) reason why Tmin (and by extension, Tavg) has gone up, at least in the mid-latitudes.
In rural environments, Tmin is also affected by corn sweat (evapotranspiration off of corn that increases the atmospheric vapor pressure; that is, the humidity, which means higher dew points and higher Tmin).
Case in point, on the right, I plotted the annual mean Tmax (red), Tavg (green), and mean Tmin (blue) for Huntsville, Alabama from 1920 to 2025. As you can see, the annual average Tmax has not increased at all. The statistically significant increase in Tavg, though, comes entirely from the even larger increase in Tmin, which is driven by UHIE. And this is not just exclusive to Huntsville; you can see it in Fresno or Boston and virtually anywhere else that isn't purely rural and/or removed from cornfields.
I like using average Tmax because it represents how warm (or hot) it actually gets (which is relevant to global warming) and, more importantly, it represents a well-mixed planetary boundary layer (PBL) where UHIE is minimized without having to adjust data that much using hypotheticals.


JR4Truth retweeted

New 2026 data
Great Barrier Reef: Last five years best on record
Why doesn't the media tell you?
aims.gov.au/monitoring-great…

JR4Truth retweeted

New study:
Since 2000, 80% of the increase in absorbed solar radiation driving global warming is explained by declining cloud albedo.
A 1% change in Earth's albedo results in a 1°C temperature change, hence "albedo governance".
Cloud cover changes are driven by natural atmospheric circulation modes and internal variability, which is supported by data showing cloud cover decline has for centuries occurred independently from "greenhouse-gas forcing".
iopscience.iop.org/article/1…


JR4Truth retweeted
Fossil China vs Green hype
You're told China is green
Reality: China is predominantly fossil fuel-powered, as is the rest of the world
China's renewable energy share 40% in 1971 when poor (wood, dung)
As average Chinese got 35x richer over the period, fossil fuels maxed at 92% in 2011, now 86% in 2024
iea.org/data-and-statistics/…


JR4Truth retweeted

𝗡𝗲𝘄 𝗦𝘁𝘂𝗱𝘆: 𝗡𝗔𝗦𝗔’𝘀 𝗠𝗼𝗱𝗲𝗹𝘀 𝗪𝗶𝗹𝗱𝗹𝘆 𝗨𝗻𝗱𝗲𝗿𝗲𝘀𝘁𝗶𝗺𝗮𝘁𝗲 𝗧𝗵𝗲 𝗖𝗮𝗽𝗮𝗰𝗶𝘁𝘆 𝗢𝗳 𝗖𝗹𝗼𝘂𝗱𝘀 𝗧𝗼 𝗔𝗹𝘁𝗲𝗿 𝗦𝗼𝗹𝗮𝗿 𝗥𝗮𝗱𝗶𝗮𝘁𝗶𝗼𝗻
NASA's models are off by 18.8 W/m² on how clouds alter solar radiation.
The modeled value is less than one quarter of what satellites record.
That gap is 94 times larger than ten years of CO2 forcing.
NASA admits the models need a hundredfold accuracy increase to detect any CO2 signal.
Read the full article:
wattsupwiththat.com/2026/07/…

