

Analysis, rationalism & objectivity are my sins
Brussels
Joined March 2009
- Tweets36K
- Following1.6K
- Followers3.8K
- Likes21.4K




Pinned Tweet
European countries start to have data up to 2024-W52 so let me start a thread with a 2024 overview (which I will complete as data gets available)
POR: Despite a big flu wave in Jan 2024, it saw only a little excess vs pre-pandemic trends (2%) equivalent to covid (2%)

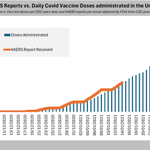
In the mail below, the data analysis provider for CDC flags that the number of daily VAERS reports far exceeding the expected level
This is hardly surprising
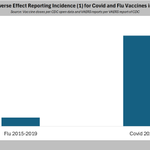
/ the expected level is consistent with historic flu values
/ the reality of covid was 10x higher
Two comments though


Look at this. The date is a typo. By January 15, 2021, injury reports were so beyond the worst-case scenario that the contractor could not keep up. NO ONE SAID ANYTHING! We have all the names of people who knew! This is from a data dump from @ICANdecide
s3.documentcloud.org/documen…

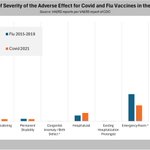
So while it is frustratingly unclear what drives the higher reporting covid vax incidence, there is one thing that the mail uncovered has revealed: Health authorities were caught off-guard about the level of reporting and have some explanation to do how they addressed this
END

ADDENDUM: I should have added a chart showing that the incidence early on in December 2020 and January 2021 deduced from the data in that mail obtained via FOIA matches actually the "80 per 100k" deduced from the VAERS database for 2021
xitter.cf/UncleJo46902375/status…


I see this study published in March for the 1st time which looks at the profile of "definitive vax injury cases"
The snag? The definition of "definitive case" is
a) healthy before vax
b) post-vax like symptoms after vax
c) no report (🤪) of covid infx
And this gets published...

And surprise surprise, the study finds that 15% of its "definitive cases" only developed post-vax symptoms more than a year after vaccination !🤪
How can such wet finger in the air analysis get published (and by Nature to boot!) is beyond me
Sigh ...
END
Source: nature.com/articles/s41598-0…

Hulscher: "CDC data now shows over 150,000 EXCESS CANCER DEATHS in America alone since mass vaccination began"
CDC data: "Huh?"


COVID SHOTS ARE ONE OF THE LARGEST CARCINOGENIC EXPOSURES IN HISTORY
Over 70% of the global population was injected with an experimental product that increases the risk of 7 major cancers via 35 distinct mechanisms.
CDC data now shows over 150,000 EXCESS CANCER DEATHS in America alone since mass vaccination began.
Just a reminder (shared with Mr Hulscher numerous times🙄)
a) the test data in that study is not randomized and in fact not representative as it predicts 10x higher prevalence than measured in randomized sera studies
b) the study has been put "under review" by the publisher
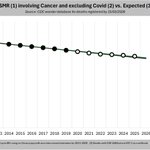
Quick warning: The result claimed here is fully dependent on the choice of the trend line
I downloaded the data and here the age-standardized view - It shows
- the classic "bump" of deaths during the pandemic
- none afterwards
So the conclusion is assumption dependent
1/


Sudden Cardiac Death Excess Mortality Ages 5 - 54
SCD Excess Mortality in younger persons continues to rise folks... 😔😡
78.6% excess and rising = 603 deaths per week
16-sigma excess
148,000 younger person deaths above and beyond the old 2010 - 2019 validated SCD rate, which was in consistent 3.36% decline. (Sources: Pediatrics (2017), Journal of the American Heart Association (2025), and Clinical Cardiology (2025).)
I include the raw data mapping here as well so that you can observe that the DFT relationship line is sound.
This is REALLY HAPPENING... we are just desensitized to it now.

Side comment: I have doubts that the choice of ICD-10 codes is a pertinent one, especially the R99 one but this is not a topic for this thread (which just shows that the conclusion is completely dependent on an assumption which relies on an outlier datapoint and is unexplained
Additional comment: @UncleJo46902375 had a deeper look and the whole "analysis" from that ethical skeptic is now definitively looking anything but ethical ...
xitter.cf/UncleJo46902375/status…
You may have seen this post from @EthicalSkeptic. I can’t replay because I’m blocked but I reckon he’s screwed up his trend line. It doesn’t match his bunch of codes and age range for CDC Wonder 2010-19.
1/3
