

Political Consultant. Former City of Dallas Chief of Staff.
Kokomo
Joined August 2009
- Tweets847
- Following1.7K
- Followers3.1K
- Likes1.2K







Pinned Tweet
There are many uniformed people on X when it comes to elections, especially in Texas. I'm getting sick of repeating myself to them consistently so I'm just going to make this thread and then point people to it.
How do we determine who a Republican or Democrat is in these models when there is no party registration in Texas?
Counties post vote rosters on their websites of everyone who votes in each election (with the exception of a few voters who are exempt such as police officers, judges, etc.) An example is this vote roster from Harris County (FYI: if you click the link below it will download a vote roster): appfiles.harrisvotes.com/har…
When someone votes in a Democrat or Republican primary they are shockingly identified as a Democrat or Republican in said model. Most of these models take this data from primaries for multiple cycles. If someone has voted in both Republican and Democrat primaries they're considered a "cross over voter" or "independent", if they voted in a Republican primary 10 years ago and have since voted in Democrat primaries they're considered Democrat.
There's a sizeable number of voters who only have voted in General Elections or are new voters, they typically get a "lean" designation based on who they live with. So if they live with a Republican we give them a lean Republican score, if they live with Democrats they get a lean Democrat. Like most things in life none of this is perfect but it's helpful.
What are your sources?
The best source are the county election pages, unfortunately none of them are uniform. They are supposed to post the roster for those who have voted by 11AM the next day. Some post it at 9PM the day of, some just outright don't post them at all and you need to hassle their offices for the files.
Here is an example of where you would find the Fort Bend County Data: fortbendcountytx.gov/governm…
Here's Brazoria County's: brazoriacountyclerktx.gov/de…
To get the data on all of these you need to go through 254 of these separate sites, email the county clerk asking for the roster, etc.

Justin retweeted

TEXAS IPEV DAY 6 UPDATE
Yesterday was the first weekend voting. The 2024 EV - 2026 recall shift is now down to 8.4 points. Adding in the other rural counties, being conservative this implies a 5 pt shift (Trump +8.7 electorate among 2024 voters).
The weekend voting saw the expected bump for Democrats, who reversed the reddening through the end of the first week. Places like Collin/Denton/Montgomery all had their bluest day on record, as they did in 2024.
We now have Bexar, and El Paso added in, and they both behave like big metros. El Paso Dems especially are putting up an extremely strong electorate shift. Tarrant Dems recovered quite a bit as well.
We added Wilson County - blue collar deep-red San Antonio exurbs. As is true with Hardin, the electorate is barely budging. But, as with Hardin, their turnout rate is low (<80% of 2024 so far for both). The same is true for the white precincts in Nederland/Groves in Jefferson County - their electorate is barely budging but their turnout is lacking.
The Latino shift is really strong still in Houston/Dallas/Tarrant/rural Hidalgo/Cameron - Dems still have a lot of votes out in Bexar/Nueces.
HD-144 in South Houston/Pasadena has a D+10 turnout shift among 2024 voters *and* 20% of the electorate not having cast a ballot in 2024. Wonder how that will break.
So far nothing too surprising here quite yet - the U-shape is manifesting, and the Republican 3/3 voters are going to continue mid-loading. Dem low prop voters are going to continue backloading towards the end of the week/EDay.
We are down from 64% of voters being 3/3 on day 1 to just 52% - so low prop voters are selecting weekends.
Sunday should probably see an influx of black voters into the electorate, followed by some red days Monday/Tuesday and then the last few days after that I would expect to get bluer.
Stay tuned for more, we will do our next Space on Wednesday!
Interactive: claude.ai/artifact/QSaAiFYUj…

Democrats in Texas had their second best day of the cycle, although with a much lower turnout all around. Expect this trend to continue today (Sunday) as it has in past cycles.
I’ll probably wait to post my model until the end of early voting as a lot of trolls have found this page and I’m too busy to explain the nuances of it.
Paxton needs people who have previously voted in Republicans to be outvoting Democrats by ~12% to win the election, currently we are at around Republican +1%. If Republicans don’t show up this last week Talarico will win.

Looks like everyone is saying it now!

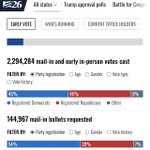
Past Republican primary voters have taken the lead in early in-person voting: 990,273 to 985,681 for past Democratic primary voters, through Thursday.
Voters with no primary history have grown every day: 22.4% of in-person voters on day 1, then 25.8%, 29.4% and 32.4% on day 4.
On day 4, they outnumbered past Democratic primary voters (30.2%) and were 2.1 points behind past Republican primary voters (34.5%).


This is a must read for Texas. Is exactly what I’m seeing.

TEXAS IPEV DAY 3 UPDATE
The third day has consistently gotten redder - the electorates in the tracked counties are well bluer than 2024 but by less so than the first two days (D+11 instead of D+12)
Most of the big counties are keeping their leans relative to 2024: Dallas/Travis/Harris are all running an electorate 8-10 pts bluer than 2024.
Potential EV frontloading in Tarrant for Dems - their turnout advantage has dropped fairly precipitously.
Dark MAGA land is starting to catch up. Deaf Smith, Potter, Randall, Hardin all had day 3 that was *redder* than the day 3 in 2024. Turnout is still horrible there though.
Indian/Pakistani precincts in Collin/Fort Bend are seeing elevated Asian turnout - this is perhaps the Bo French backlash.
Overall EV is more Latino and younger.
Still lots to go, but Democrats are still in the driver's seat. If I had all the rural counties to add in, the recalled electorate would probably be Trump +7 or so. Eminently doable for a Dem to get 7 points of persuasion in this environment - but we can't directly measure that.
I will try to add more counties if they can get me data in time. Next EV space will be on Friday to talk about latest results.
Interactive here:
claude.ai/artifact/QSaAiFYUj…


Justin retweeted

TX Voted Early or Absentee as of 10/21/26 // 684,709
General Election
Modeled Party ID: Democratic 52.0% / Republican 44.5% / Nonpartisan 3.5%
Ages: 65+ 76.3% / 50-64 13.0% / 40-49 3.5% / 30-39 2.2% / 18-29 1.8% / Unknown 0.1%
Gender: Female 51.8% / Male 48.2% / Unknown 0.1%
Ethnicity: White-European 59.9% / Hispanic & Portuguese 21.4% / Unknown 7.8% / African American 7.2% / East & South Asian 2.4% / Other 1.3%
Veteran: 4.3%
Additional Highlights:
-- Household size: Two-person households are the largest segment at 28.8%
-- Gun ownership: 9.3% are identified as living in a gun-owning household
-- Frequent voters: 41.2% have voted in six to eight tracked elections
See early data in all districts and states: early.l2datamapping.com/


