
Visualization Lab @ Khoury College of Computer Sciences, Northeastern University 🐘 https://teapaw.org/t.co/VVorcdwCQu
- Tweets550
- Following433
- Followers381
- Likes440





ALT Presence of the Northeastern University Khoury Visualization Lab at IEEE VIS 2026: 12 papers, 3 posters, 2 workshops, and 1 panel. One of the papers, Visualizing High-Dimensional Graph Embeddings via Informed Multi-View Projections, received honorable mention.

ALT A three-step workflow diagram showing how to visualize uncertainty in non-linear projections. From left to right, high-dimensional data are used to generate multiple non-linear projections, with added noise or sampling to perturb the input data. The resulting projections are then visualized using five ensemble visualization methods, namely median projection, small multiples, confidence ellipses, movement lines, and kernel density estimation (KDE) with binned points.


ALT Graphic to promote a Khoury News piece. At the top is a collection of headshots of Khoury faculty and staff featured within the article along with a "VIS 2026" logo in the middle in pink and orange text. Below is the headline in black text which reads: "Khoury researchers highlight data accuracy, clarity, and usability at IEEE VIS 2026". In the bottom lefthand corner is a subheading in bold, black text that reads: "By Caroline Baker Dimock."

ALT The picture shows two viewers standing in the front of a large interactive screen displaying clusters of triangle marks that represent pollution data.

ALT An event poster for the data-inspired show "The Numbers," directed by Jonathan Carr and devised by the company. A QR code for ticket registration appears at the bottom left. At the bottom right, it lists the show running from November 13–23, 2025, at the Studio Theatre, presented by Northeastern University’s Department of Theatre.

ALT Screenshot of a paper titled "An Autoethnography on Visualization Literacy: A Wicked Measurement Problem" by Ge et al. The figure below shows the lifecycle of a visualization literacy assessment, including three stages: Conceptual, Methodlogical, and Operational, with example calls to action.

ALT A diagram from a Creamer et al. paper showing the experimental design and results of a study replicating the use of augmented reality in astronomy publications.

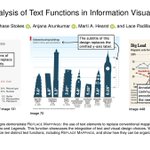
ALT A figure from a Stokes et al. paper illustrating "Replace Mappings" in data visualization, using three example charts where text annotations replace traditional elements like axes and legends.

ALT Three-panel summary of experiments showing how chart-type schemas and directional cues influence expectations and accuracy when interpreting connected scatterplots. The title reads "Shifting Expectations for Encoding Rules Mitigates Misinterpretation of Connected Scatterplots."

ALT Screenshot of a paper titled "Stitching Meaning: Practices of Data Textile Creators." Below the title is a figure showing two data textiles pieces – a colorful “book blanket” and a striped “temperature blanket.” It illustrates how textile patterns encode data and describes study focus areas on data, creator motivations, and visual encodings.

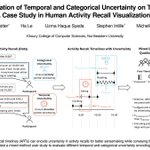
ALT Screenshot of a paper titled "An Evaluation of Temporal and Categorical Uncertainty on Timelines: A Case Study in Human Activity Recall Visualizations." A diagram below the title summarizes a study on how people recall daily activities with uncertainty. It shows examples of participants describing uncertain times and activities, corresponding visual timeline encodings, and study results from 81 participants.

ALT Graphic for a Khourys New Article. The image has a white background with a headline in bold black text that reads, "Lace Padilla wins VGTC research award for studying uncertainty in data visualization." Right under the headline is a subheading that says, "By Caroline Baker Dimock". Above the text is an image of Professor Padilla writing on a whiteboard.

ALT Poster showing a grid of data visualizations recreated using different artistic media. Rows correspond to mediums – pencil, dip pen, crayon, colored pencil, watercolor pencil, and watercolor – while columns show different uncertainty visualizations.

ALT Diagram illustrating four stages of a network optimization process: (a) candidate node selection, (b) neighborhood selection, (c) optimizing the neighborhood, and (d) resulting layout with fewer edge crossings. Arrows guide the process flow from left to right and back to the start.