Emmanuel (@Landa23) header
Emmanuel (@Landa23) profile picture

Fundador MORLAN & DataLabMx @MxDatalab. Física PhD SNI I |Esp. Economía Monetaria & Financiera |Economatría |Inf Geoespacial #DataScientist

CDMX, México
Joined May 2009
Photo by Emmanuel (@Landa23)Photo by Emmanuel (@Landa23)Photo by Emmanuel (@Landa23)Photo by Emmanuel (@Landa23)Photo by Emmanuel (@Landa23)Photo by Emmanuel (@Landa23)Photo by Emmanuel (@Landa23)Photo by Emmanuel (@Landa23)Photo by Emmanuel (@Landa23)Photo by Emmanuel (@Landa23)
One of the fascinating lessons of Jensen Huang's resignation is about power. Just a few weeks ago he was described as the most powerful engineer in the world. No more. The paradox of power is that the more of it you have, the more vulnerable you are. 1/
17
95
14
391
47,248
Emmanuel retweeted
Here's Looking at Euclid by Helen Friel. Helen Friel is a paper engineer and she make beautiful things. Look at these paper sculptures of Oliver Byrne's version of Euclid's Elements. abakcus.com/articles/heres-l…
2
37
3
240
9,876
🍻 El 25 de noviembre, Adrián Sánchez-Castro nos cuenta cómo llevar agentes de IA a producción en Latinoamérica, con retos e integraciones. 📍 @EGobiernoyTP, CDMX | 6:30 p. m. 🎟️ luma.com/d4kzxqio Con el apoyo de @ColegioBourbaki. ¡Pásenle, hay mesas! #TheDataPub
1
3
29
613
Have you seen this stunning interactive 𝐁𝐢𝐫𝐝 𝐌𝐢𝐠𝐫𝐚𝐭𝐢𝐨𝐧 𝐄𝐱𝐩𝐥𝐨𝐫𝐞𝐫 yet? explorer.audubon.org/home 𝐓𝐡𝐞 𝐍𝐞𝐰 𝐒𝐜𝐢𝐞𝐧𝐜𝐞 𝐨𝐟 𝐌𝐚𝐩𝐬 - thenewscienceofmaps.com/
9
51
1,123
Just received this in the mail today: The Welch Labs - Illustrated Guide to AI". What an astonishing, gorgeous work of art! Bravo, Stephen Welch and team!
34
117
7
1,723
60,506
Emmanuel retweeted
📈 ¿Puede el PSOE superar al PP? La ventaja del PP ha caído de 6 a 4 puntos en nuestro promedio, y la encuesta de 40dB los deja a solo 2. ¿Probabilidades? Nuestro modelo dice que el PSOE queda primero el 20% de las veces. Lo contamos hoy en nuestro pódcast "Entre datos" 🎧👇
60
88
20
376
147,864
For the past year @BasisOrg has been building a general framework for probabilistic reasoning in dynamical systems, called Dynestyx. Blog: basis.ai/blog/dynestyx/ Dynamical systems are the workhorse of science and engineering: robotics, epidemiology, climate, biology, etc. The basic thing you can do with a dynamical system is simulate it: run it forward to compute how it will evolve over time. Dynestyx goes beyond this and lets you do inference and reasoning in dynamical systems. This includes: - Forecasting: What will happen next, and how sure are we? - State inference: Given noisy, partial measurements, where has the system actually been? - System identification: How does the system work? What parameters and rules produced the data we see? - Causal reasoning: Given the evidence, what would happen if we intervened on the system? Dynestyx allows you to do probabilistic inference over all kinds of dynamical systems (ODEs, SDEs, PDEs). You (or an AI agent) write the model once, then swap in different inference methods with minimal changes. Its generality allows us to tackle many different systems, as shown in the GIFS: - recovering a high-res Navier–Stokes fluid flow from noisy low-res measurements - steering particles through the wake behind a cylinder - a robot hand turning a cube it can only see through a camera - forecasting a 1978 flu outbreak at a boarding school as the data comes in Also: it's open source. Please give it a try: github.com/BasisResearch/dyn… Led by Matt Levine and @DanWaxmanML, with many contributions from our research staff
13
52
4
371
18,270
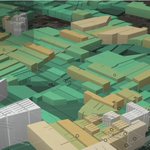
#30DayMapChallenge Day 10 - Prompting only Central's pedestrian network in 3D, Hong Kong Shared the whole map challenge working folder and asked GPT-6.1 to create a map. I even didn't specify the theme they should work on
1
1
1
14
789
It's remembrance day! 🌺 An excellent day to read a reflection on the horrors of WWI and browse a data vis poppy memoriam. maggieappleton.com/in-memori…
2
3
61
3,288
What if we designed materials the way nature builds its networks? Our @Nature paper introduces Scale-Rich Materials with remarkable properties: tunable stiffness, impact absorption and wave control. PDF at barabasi.com/science/publica… #NetworkScience #NetSci #NetworkMaterials
4
29
1
198
9,528
[🔊 Sound on] Earth's Breath: the average color of the land, seen from space by @NASA MODIS every 8 days for two years. #30DayMapChallenge Day 11: Sound
1
11
716
CARTOGRAFÍA » Completísimo análisis del @WSJGraphics sobre los históricos resultados electorales en las 'midterms' de la pasada semana: inconsolata.com/post/8327243…
6
23
1,016
Emmanuel retweeted
493 años de expansión urbana de Cartagena en 80 segundos. Reuní planos antiguos, censos, cartografía oficial e imágenes satelitales para reconstruir cómo se ha extendido Cartagena desde 1533 hasta hoy. En ese tiempo, su área urbanizada se multiplicó por más de 500, pero a ritmos muy distintos. Durante más de tres siglos apenas salió de sus murallas, y en el siglo XX se expandió super aceleradamente. La ciudad se extendió pero también cambió su forma de ocupar el suelo. Durante el siglo XX, el área urbanizada y la población aumentaron casi al mismo ritmo. Pero desde 2000, el área urbanizada aumenta más rápido que la población (44% frente a 29%). Hoy cada habitante ocupa más suelo urbanizado que antes. La ciudad se está volviendo más extensa y menos densa, y esa tendencia ejerce una presión cada vez mayor sobre varios ecosistemas. Además, Cartagena siempre se ha expandido en relación con el agua (a veces adaptándose a los cuerpos de agua y a veces rellenándolos). Durante siglos la ciudad rellenó caños, lagunas y manglares, como La Matuna, Chambacú y el borde de la Ciénaga de la Virgen. Solamente en los últimos 40 años se urbanizaron unas 180 ha que antes eran cuerpos de agua. Mucha de esa expansión está en tierras bajas, expuestas a inundaciones y al aumento del nivel del mar. Feliz día de la #independencia. Fuentes: DANE, Censos nacionales y proyecciones municipales; Aguilera y Meisel (2009); Segovia (2013); IDOM y Findeter (2017); planos antiguos (Jorge Juan y Antonio de Ulloa, Thomas Jefferys, Antonio de Arévalo, entre otros); Instituto Geográfico Agustín Codazzi; Diagnóstico 2000 para POT; Diagnóstico 2025 para POT; MapBiomas Colombia; Sentinel-2 (2024-2026); Archivos Banco de la República. #30DayMapChallenge
14
125
6
477
14,331
#30DayMapChallenge | Day 10: Prompting 🇲🇽 Thirsty fields, generous sun. Using GIS, I mapped where Mexico’s irrigated farmland meets intense solar radiation and water stress. Could #agrivoltaics turn water scarcity into opportunity? One land. Two harvests. @Agro_Watts
1
11
88
2,634
Emmanuel retweeted
Atendendo a muitos pedidos, os resultados por seção eleitoral já estão disponíveis no Visualizador Eleitoral do ElectoMaps! Mais uma forma, totalmente GRATUITA, de acompanhar a democracia em ação em nossa plataforma. Desfrutem! electomaps.com.br/eleicoes
4
21
4
168
5,441
This week's Data Vis Dispatch covers the historic results of the U.S. midterm elections 🇺🇸🗳️, Paris' population density 🇫🇷👥, bicycle-friendly cities 🏙️🚲, grocery prices 💵🍎, and the Pancake Index 🥞. Explore these topics and much more in the newly posted blog👇 datawrapper.de/blog/data-vis…
3
29
1,556
Peak mapping in the #30DayMapChallenge by @Alexander Semenov. Space syntax and isovists are certainly having a moment this year, perhaps also signaling that the human component and its interaction with structural urban data (like buildings, road networks) are finally getting to their well-deserved place! For those new to this method: isovists, the area visible from a given point on the street, are a great perception-based alternative for a walkability score for a place or even safety - what people can actually see often tells a lot about a city. Of course, this is a model, also our sight range does not have a fix range but a decaying accuracy, but the field is still early on, and more simple models have a lot to offer. 𝐒𝐨𝐮𝐫𝐜𝐞: linkedin.com/posts/sasfeat_i… 𝐓𝐡𝐞 𝐍𝐞𝐰 𝐒𝐜𝐢𝐞𝐧𝐜𝐞 𝐨𝐟 𝐌𝐚𝐩𝐬 - thenewscienceofmaps.com/?utm…
2
30
2
233
8,707