

Born in the bearmarket 🎯 Partner | @upshot_cards 🏄♂️ Wave Rider at @SurfAIHQ
Dubai
Joined January 2013
- Tweets82.5K
- Following937
- Followers2.8K
- Likes115K
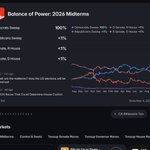








Democrats sweep, what’s next for the market?
the market may have already priced a win into asset prices too aggressively
a democratic win doesn’t necessarily mean the market will drop
maybe this is exactly what the market is missing right now
checks and balances against trump’s unpredictable policies
what could change?
> it will be harder for trump to push through decisions without political opposition
> congressional oversight, investigations, and scrutiny of the administration’s actions will increase
> political uncertainty could ease, markets don’t like surprises, especially when they come from the white house
on the other hand, democrats could review defense spending, increase regulation of ai and data centers, and boost social spending
maybe the market doesn’t need an election winner, just an end to the political chaos under Trump and the chance to trade based on fundamentals again


update on the US Senate odds
my bet on Republicans winning the Senate on @Polymarket is still live
> Democrats: 77% → 73%
> Republicans: 24% → 28%
i still think the market is overestimating the Democrats’ chances
22 of the 33 senators up for election are Republicans
many elections are happening in traditionally Republican states, so a Democratic win is far from guaranteed

update on the US Senate odds
my bet on Republicans winning the Senate on @Polymarket is still live
> Democrats: 77% → 73%
> Republicans: 24% → 28%
i still think the market is overestimating the Democrats’ chances
22 of the 33 senators up for election are Republicans
many elections are happening in traditionally Republican states, so a Democratic win is far from guaranteed
us senate elections
Republican Party - YES ($20 > $83)
that’s a potential 316.7% return on the prediction
on @Polymarket, 77% are betting on the Democrats, but i wouldn’t agree with that
i think this probability is overstated, in my own estimation, it’s closer to 50/50
the argument: Republicans from traditionally republican states take part in the elections, so Democrats won’t necessarily get a majority
22 of the 33 senators up for reelection are Republicans
many elections are happening in traditionally republican states

closed my oil short in profit: +23 usdt
entry: $97.95 > exit: $96.04
position: CLUSDT perp, 3x
why oil could keep falling:
the geopolitical premium is gradually fading
any signs of de escalation around Iran could sharply shift the market balance
Trump wants fuel prices to come down. high oil prices are becoming a political problem for republicans, especially with voters in a negative mood
supply is starting to weigh on the market
forward spreads had already signaled weakness while oil prices kept rising
after the midterms, there could be a stronger push to negotiate and reach a deal
in my opinion, oil could move toward $90 and then test the previous low around $88
if de escalation actually happens, $80 or lower is possible
any unexpected escalation could push oil back above $100
my idea isn’t to catch the falling knife right now, but to use bounces to look for shorts

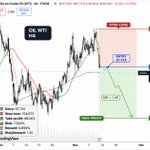
opening a short on oil USOIL (WTI)
after a strong rally, oil ran into sellers around $104–105
the sharp selloff that followed makes me think the correction could continue
why I chose to short the token:
> price faced strong bearish resistance near the local high
> a sharp move down on the 4H caused buyers to lose short term control
> price broke through local support, increasing the odds of further downside
> looking for a move toward previous demand and support zones
my trading plan:
> entry: $97.734
> stop loss: $104.912
> take profit: $88.063
> risk/reward: 1.35
the current price is already below the entry, but the main goal of the trade is for the drop to continue toward $88.063
if oil moves back above $104.912, the bearish scenario will no longer be relevant

us senate elections
Republican Party - YES ($20 > $83)
that’s a potential 316.7% return on the prediction
on @Polymarket, 77% are betting on the Democrats, but i wouldn’t agree with that
i think this probability is overstated, in my own estimation, it’s closer to 50/50
the argument: Republicans from traditionally republican states take part in the elections, so Democrats won’t necessarily get a majority
22 of the 33 senators up for reelection are Republicans
many elections are happening in traditionally republican states
opening a short on oil USOIL (WTI)
after a strong rally, oil ran into sellers around $104–105
the sharp selloff that followed makes me think the correction could continue
why I chose to short the token:
> price faced strong bearish resistance near the local high
> a sharp move down on the 4H caused buyers to lose short term control
> price broke through local support, increasing the odds of further downside
> looking for a move toward previous demand and support zones
my trading plan:
> entry: $97.734
> stop loss: $104.912
> take profit: $88.063
> risk/reward: 1.35
the current price is already below the entry, but the main goal of the trade is for the drop to continue toward $88.063
if oil moves back above $104.912, the bearish scenario will no longer be relevant
my service confirms the ethereum:native signal LONG
here's why:
> price is rising along with open interest (+1.31% over 24h), new positions are entering the market, supporting the trend’s continuation
> long/short ratio - 1.066: shorts slightly outweigh longs, creating potential for a short squeeze
> put/call oi ratio - 0.544: calls are in the lead, options point to a bullish outlook
> eth is near the bottom of its 14 day range, leaving room for a recovery
> order book: bid liquidity outweighs ask liquidity, $7.98m vs $3.02m
risks: long liquidations ($12.68m) exceed short liquidations ($24.03m), which could increase pressure on buyers
bottom line: ETH remains bullish
my positioning terminal model shows a long bias at 56.3% versus 43.7% short
this is just a model score, not the probability of a trade succeeding, so assess the risks yourself
key resistance zone: $2,298–2,310
this is where we’ll test the buyers’ strength - LONG


a chart that can help us tell if it’s going to be a bull market
the TGA is an indicator that helps us understand where liquidity in the market comes from
the Treasury General Account is the us treasury’s account at the FED
basically, it’s the us government’s savings account
money moving in and out of this account affects the financial system’s liquidity
> if the TGA goes up
the government raises money, for example, by issuing bonds
funds are moving from the private sector to the government’s account
liquidity in the financial system could potentially decrease
this could put pressure on bitcoin:native, stocks, and other risk assets
> if the TGA declines
the government spends its accumulated funds
money is flowing back into the private sector, supporting bank liquidity
this could be bullish for crypto and the stock market
this is what we’re seeing right now
the tga is nearing $1 trillion again
this means a significant amount of money is sitting in a government account rather than the private sector
if the tga starts declining steadily, it could provide additional support for the market
if it keeps going up, liquidity could come under pressure
right now we're waiting on two possible outcomes
what are we waiting for next
bullish scenario for bitcoin:native :
> the TGA is starting to steadily decline
> the treasury is spending its accumulated funds
> the fed balance sheet isn’t shrinking too fast
> bitcoin ETFs are showing steady inflows again
> BTC is reclaiming key technical levels
bearish scenario:
> TGA keeps growing
> the fed is shrinking its balance sheet
> ETFs are seeing outflows
> liquidity and risk appetite are getting worse
i’ll leave the chart link in the comments


at one point i had 20+ ZAMA OG and sold them successfully after the pump to $30
i also kept 5 of them to hold forever as a tribute to the team and the project
now i know i'll get an airdrop from @FungoLabs
how many @zama OGs are still around here?


🪂 $FUNGO Airdrop!
→ Fungo Genesis NFT holders
→ Zama OG NFT holders
→ X Campaign
We’ll share the details and more soon.

gold drops exactly when the market gets scared
ethereum:0x68749665ff8d2d112fa859aa293f07a622782f38 is traditionally seen as a safe haven
so why is it being sold off during market panic?
one possible explanation is a lack of liquidity
when volatility spikes and margin requirements go up, investors need cash on hand
even strong assets like gold have to be sold to cover losses on other positions
this doesn't necessarily mean the long term bull trend is over
key levels:
> $4,100 - potential reversal confirmation
> $4,300–4,350 - next resistance zone
> $4,560–4,580 - main upside target
> $5,000 - long-term target
> $3,800–$3,850 is the nearest support zone
if gold gets back above $4,100 and buyers show up again, we could see the price move higher

the bullish scenario is still possible for bitcoin:native
Bitcoin is holding up well despite negative news and pressure across the whole market
here are my bullish takes
> whales keep accumulating BTC on the spot market
> short term speculation and the crowd of longs have dropped noticeably
> the skew toward shorts could fuel a sharp move up
> a return of capital inflows into bitcoin etfs would be an additional bullish factor
BTC is trading around $77,600 after losing the $80,177 level
key levels:
> $80,177 is the nearest resistance we need to reclaim
> $82,000–82,500 is the next resistance zone
> $86,000–88,000 is the upper zone of interest
> $64,000–65,500 is an important previous accumulation zone
> $60,070 is deeper support
until btc reclaims $80,200, it’s way too early to call this a bullish trend
but if spot demand recovers, etfs turn positive, and shorts start closing, a move to $85–90k could be very real
over these two weeks, we’ll know for sure where the market is headed
$80.2K is the level to watch

if we don’t see bitcoin:native rise and bounce back up in the next two weeks
then something is going wrong and something has broken
then we could see the price drop
today is October 31 and there are 16 hours left to claim rewards from the $21,512 pool @upshot_cards
my rank is #57 (top 1%)
October LB reward is $115
the top 100 split most of the prize pool every month
check your position using the link below

all the worst case scenarios hit the market at once
objectively, no one could have predicted that all the cards would fall into place like this
sentiment in the market is as pessimistic as it gets right now
the only comparison is 2022, when FTX collapsed
but it’s not all as bad as it seems, let’s take it one step at a time
here’s what’s happening with us right now:
> the situation with Iran still has no logical resolution
> oil prices remain near record highs
> the highest mortgage rates in the us in the last 25 years
> earnings reports from hyperscalers ($GOOG, $AMZN, $META, $INTC) are terrible
> @binance hacked for a record amount of over $6B
> headlines everywhere say the ai bubble has burst
> Blackrock etf sells $233,000,000 worth of bitcoin:native
but it’s not all bad, because market bottoms usually form after this kind of stress
the next major elections in the us are the 2026 Midterm Elections on November 3
i’m sure the democrats did a lot of manipulating before these elections to take down trump’s team
this is exactly where we can expect a reversal and a bounce
and after all these events, we could see the democrats win
because they’ll start saving the market and showing it to everyone
this is a total defeat for republicans
I built Crypto Positioning Terminal
an analytics service that shows where money is flowing in the crypto market, who’s building positions
where liquidity is concentrated, and which way the market is leaning right now
Instead of looking only at candles and indicators, the service pulls data from several parts of the market:
> futures and spot: open interest, funding, long/short, liquidations, capital flows and order book
> options: put/call, open interest, max pain and key price levels
> hyperliquid: comparing positioning on DEXs and centralized exchanges
> on-chain and ETFs: coin movements, exchange flows and institutional activity
based on this data, the tool analyzes bitcoin:native, ethereum:native, and solana:So11111111111111111111111111111111111111112
it also finds 3 altcoins with the highest probability of a volatility expansion
here’s what the tool shows you:
> market direction: whether buyers or sellers have the edge, with an explanation of why
> volatility thermometer: probability of a strong move in the next 4 hours
IMPORTANT! Not the direction, just the expected size of the move
> trading scenarios: entry conditions, two take profit targets, invalidation levels, and arguments for and against the trade
> signal history: you can check how closely the forecasts matched the actual price movement
Crypto Positioning Terminal doesn’t generate signals just for the sake of it
if there isn’t enough data or the conditions aren’t met, the trading plan won’t appear
it’s important to understand that this isn’t a trading bot
this is a tool that helps make decisions based on market data
the link to the service will be in the comments
created with help from @SurfAIHQ
#SurfStudio

seeing major platforms get hacked on the same day
but it feels like the market is so exhausted that nobody cares anymore
before, active coins would correct by 20% on negative news like this
so this time, the moves were 3-5% down
are we washed out?
the crypto market just saw the biggest hack in its history
~$6.36B was withdrawn from Binance hot wallets in the past 24 hours
that’s about 4.2x more than what was stolen in the Bybit hack in February 2025
here’s what happened:
> total amount stolen: $6.36B
> frozen thanks to actions by stablecoin issuers and the Arbitrum Security Council: $2.69B
> still not frozen: $3.66B
> separate attack on Polymarket through a third party script: $2.7M
the most interesting part is exactly how @binance was attacked
according to TRM labs, the attackers gained the ability to use the transaction signing infrastructure for hot wallets
Funds started getting drained from multiple chains at once through the EIP-7702 mechanism and pre-signed authorizations
Binance said its own devops engineer’s laptop was compromised and a service container was accessed
at the same time, the exchange says wallet private keys were not leaked
Binance said it will cover all user losses with its own funds and SAFU
@SurfAIHQ helped put together the full analysis
you can read the full report in the comments below

