

Popular community group, free events on data and analytics. Monthly online series during lockdown.
London
Joined July 2014
- Tweets312
- Following186
- Followers670
- Likes52


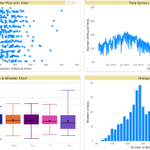




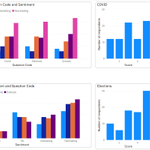
Our latest LBAG video demos how to visualise balance sheet data with Power BI. youtu.be/m3tR5aX52fk Chapter sections and datasets included!

2
Our latest LBAG YouTube video, Visualising Distributions in #powerbi (8 minutes) youtu.be/rOemr3sz2vw, shows spread of values of daily London bike hires using histograms, box & whisker, scatter and time-series charts.

3
London Business Analytics Group retweeted

When people comment on slow vaccination rates someone always jumps in with "it's a marathon, not a sprint".
Maybe. But when you're vaccinating the most at-risk first, and the death aversion curve looks anything like the one below (👇), you should be sprinting out of the blocks.


London Business Analytics Group retweeted

Daily COVID-19 vaccine doses administered per million people (7-day average):
🇮🇱 Israel 14,498
🇪🇸 Spain 1,209
🇩🇰 Denmark 1,069
🇺🇸 United States 1,025
🇬🇧 United Kingdom 639
🇩🇪 Germany 470
🇲🇽 Mexico 38
Our database: ourworldindata.org/covid-vac…
LBAG has two events this month. On Monday at 1pm, Chris Barber teaches basic relationships in #powerbi. On the 26th, Prof. Mark Whitehorn explains how ROC Curves can evaluate #machinelearning models. All welcome. Events are free. Details at meetup.com/London-Business-A…

Our latest video at youtu.be/NsA1gVZvRtw is a 10 minute tutorial with the powerful #Mapbox visual in #PowerBI. The map shows deprivation in London using data from #MHCLG. This is the first of several videos exploring the IMD data.

Thanks @soulsinporto , really nice to hear that. We now have 30 videos and are adding more each week, training tutorials based on case studies using #powerbi

I've mentioned @LonBizAnalytics's channel before, but I really recommend going trough all their videos. You'll learn a lot about Power BI, the videos are accessible for beginners and you get a chance to create some neat dashboards for real-world data
youtube.com/channel/UCfXiJFE…

1
2
There is a second chance to hear Chris on APIs in Power BI tomorrow (Tuesday, 23rd June) at 7pm https://teapaw.org/t.co/cr9qDFpKA2

A splendid presentation and demo by Chris Barber from @AltiusData on importing dynamic JSON data into Power BI via an API using RelativePath
Thank you @LonBizAnalytics for hosting!
community.powerbi.com/t5/Com…
https://teapaw.org/t.co/Ru44EdeiOG
blog.crossjoin.co.uk/2016/08…
youtube.com/channel/UCfXiJFE…


Our latest video lnkd.in/eH3uJ6t shows how to prepare a well-known machine learning dataset in #PowerBI - plot a histogram, box and whisker plot and a ‘home-made’ swarm plot then shape the dataset in the Query Editor and standardise the data with a few #DAX calculations.

Seven LBAG events in next few weeks. Everybody welcome. Sign-up at meetup.com/London-Business-A… #PowerBI

Our latest video about exploring the results in the 2019 UK General Election with #powerbi at youtu.be/9Mvs9GlfELY (20 minutes) .
LBAG’s popular weekly live online events is on Monday 1pm & Tuesdays 7pm – full details at meetup.com/London-Business-A… Please join us.

1
LBAG’s lockdown series continues with ‘Gathering data from APIs in #powerbi on Monday June 22nd meetup.com/London-Business-A… This will be the 14th week of LBAG’s lockdown series. Please join us.
YouTube video of the word frequency analysis in #powerbi tutorial youtu.be/9QlE9WIU6Xg From this week’s LBAG lockdown series event.

2
Highlights of this week’s session on Analysing and Visualising Survey Results in #powerbi at youtu.be/wmuDZflUAxY
The YouTube channel for videos of previous 11 weeks of the LBAG lockdown series is youtube.com/londonbusinessan…

Short preview (1 minute read) of next week's LBAG session on analysing UK election results in #powerBI linkedin.com/pulse/sneak-pre…. Details and signup at meetup.com/London-Business-A… Mon 1pm, and again Tues 7pm.

1
On June 16th at 7pm Professor Mark Whitehorn will talk on ‘Introduction to Machine Learning’. Full details at meetup.com/London-Business-A…. This is part of LBAG’s “lockdown” series of weekly events. Please join us.
Attendees at today's meetup. Can you see when Q&A started? Thanks again to @benrebooted for the wonderful Power BI template.

Tomorrow/Tuesday, our 11th weekly online event, we analyse survey data and “Dr Jekyll and Mr Hyde” using Power BI & R. All welcome. meetup.com/London-Business-A…

1

Last week's event - build football's EPL results table from match data in SQL, R, #powerbi – R video highlights youtu.be/eMTlR6Z44BA
