

Passionate about obscure pop culture references.
Melbourne, Australia
Joined March 2015
- Tweets880
- Following373
- Followers453
- Likes709







Now this is new technology to me, but I'm pretty sure that's Kawhi Leonard in the oven, rotating slowly. His body temperature has risen to over 400 degrees he's literally stewing in his own juices! #kawhiwatch


Marc De Chellis retweeted

Fight and fight and WIN!
Full time - Richmond 15.9 (99) defeat Port Adelaide 14.8 (92)
#AFLPowerTigers #gotiges

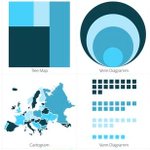
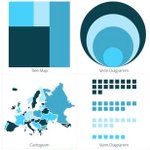
Check out these 3 Interactive Maps we've designed hubs.ly/H0csRVz0 #dataviz #interactive #design #maps #cartography #d3js

101 Free Data Visualization Resources - Ideas, Tools & More! hubs.ly/H0csRgQ0 #data #dataviz #design #infographics #tableau #powerbi

101 Free Data Visualization Resources - Ideas, Tools & More! hubs.ly/H0ckCDL0 #data #dataviz #design #infographics #tableau #powerbi

Imagine how insightful, engaging & fun data could be if you could experience it?
Discover the top 5 trends that will revolutionize data visualization in 2018 hubs.ly/H0ckCD70 #dataviz #data #bigdata #analytics #interactive #maps #VR #VirtualReality #innovation

Find out what innovations the new version of #Tableau offers us, data enthusiasts 🙏 we have been LOVING this new update! #dataviz #design
Four Exciting New Tableau Features! hubs.ly/H0cbnYy0
Designing a dashing #dashboard like a PRO hubs.ly/H0c9dNM0 #design #tips #dataviz #infographics #marketing #tableau
Interactive #maps with LIVE demos! hubs.ly/H0c9fqS0 by @DatalabsAgency #infographics #dataviz #IWDA #Victoria #Melbourne #Australia #business
Here are some hierarchy #RULES in #dataviz. Does your design make the cut? hubs.ly/H0c3jTt0 by @DatalabsAgency #dashboard #strategy #tableau #powerbi

Make your designs memorable, understandable, and actionable through repetition, alignment, and symmetry. New on our blog! #dataviz #design #ui #ux
Data Design Principles: Repetition, Alignment, Symmetry hubs.ly/H0b-PT_0
It's @tableau vs @MSPowerBI - Which BI Dashboard is Best? hubs.ly/H0bZyqJ0 #Tableau #PowerBI #BI #Design #Blog

BE WOWED. Here are the Top 5 Best Interactive Data Viz we've ever seen...all combining data, technology and beautiful design 💫 #dataviz #interactive #design #technology
5 Best and Most Fascinating Interactive Data Visualisation hubs.ly/H0bZwQy0
We collaborated with International Women's Development Agency (IWDA) to create this #live #map for demonstrating the #reach and #locations of #IWDA #partnerships and #coalitions throughout the #world. hubs.ly/H0bZxsZ0
Today we reveal the secrets to picking the perfect images for your design! 🏞 guaranteed to make your designs more effective 🙏🔥 #design #dataviz #photography
Data Design Principles: Photography hubs.ly/H0bZwQr0
Knowing the unspoken meaning and the effects of #colours on the majority of people is an incredibly valuable knowledge that designers can master and offer to clients hubs.ly/H0bZy430 by @DatalabsAgency #design #principle dataviz
