

PhD Student @uvmmathstats & @uvmcomplexity | Interested in stochastic math models, hiking & skiing
- Tweets75
- Following280
- Followers231
- Likes742


ALT Positroids and Graphs. Faculty Mentor: Dr. Puck Rombach

ALT Odd Covers of Graphs. Faculty Mentor: Dr. Puck Rombach

ALT Temporal and probabilistic forecasts of epidemic interventions. Faculty Mentor: Dr. Laurent Hébert-Dufresne


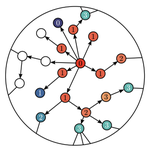
ALT FIG. 1. Schematic of generations of infection through a network with interventions. An initial node is infected during generation 0 (shown in deep red). Subsequent epi- demic generations are represented in shades of red, with each node labeled in black by the generation in which it was in- fected. The blue shaded nodes were part of an intervention (e.g., vaccination), hindering the spread of the infection along that branch of the tree if the intervention preceded a poten- tial transmission. Interventions are also temporal, shown in shades of blue and labeled in white by the epidemic generation when their intervention occurred. The branching dynamics of the resulting transmission tree are highly complex as the two dynamical processes compete, with the disease potentially spreading exponentially but slowing down as the intervention ramps up.


