

Trader sharing my market notes, stock setups, and lessons from the charts Always learning. Always managing risk
Joined December 2025
- Tweets4.9K
- Following4.8K
- Followers9.9K
- Likes4.8K



$GM
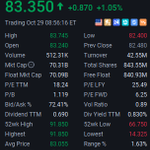
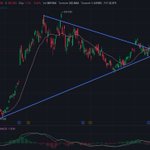
After the post was published, the stock price fell back to the buy point of $74, then quickly rose to the current $83, an increase of over 12% 💵💵💵💵💵


🚀 $GM — Buy Watchlist
Retesting the Uptrend Line 📉
Current Price: $78.28
🔥 Resistance: $81.50 – $85.00
🎯 Target Price: $90 → $91.85 (Previous High)
💡 Ideal Pullback Range: $76.00 – $78.00
🛡️ Support: $74.00 – $76.00
The stock price is currently below the Bollinger Band middle line ($81.45) and is pulling back towards the uptrend line (indicated by the blue arrow). The MACD histogram is positive (DIF -0.48 / DEA -0.55 / MACD +0.14). A buy in the $76-$78 range is recommended; a break above $81.50 with increased volume can be used as confirmation of a buy.
📅 Earnings Announcement: The company expects the next quarter to end in October 2026, with estimated earnings per share of approximately $2.40.
#GeneralMed #NYSE #Automotive #ElectricVehicle #ConsumerProducts #FederalOpenMarketCommittee #Earnings #Value #Manufacturing #StockMarket

🚀 $TPL — Buy Watchlist
Pullback to Horizontal Support Level 📉
Price: $333
🔥 Resistance: $360 – $380
🎯 Target Price: $450 → $500 (Previous High $547.20)
💡 Ideal Pullback Range: $325 – $333
🛡️ Support: $310 – $325
Price is below the Bollinger Band middle line ($346.18) and is testing the $325 support level. The MACD indicator is weak (DIF -5.86 / DEA -4.52 / MACD -2.68). Focus on the support level first; only small positions are recommended until the price strongly rallies above $360.
📅 Earnings Reminder: Earnings are expected to be released in early November 2026, with projected earnings per share of approximately $1.80.
#TPL #NYSE #Land #Energy #PermianBasin #FederalOpenMarketCommittee #Earnings #Value #Royalties #StockMarket

🚀 $DE - Buy Watchlist
Pullback to Uptrend Line 📈
Price: $642
🔥 Resistance: $670 – $700
🎯 Target Price: $721.22 → $750 (Previous High)
💡 Ideal Pullback Range: $620 – $640
🛡️ Support: $600 – $620
Price is currently testing the uptrend line, hovering below the Bollinger Band midpoint (649.20). The MACD indicator is near the zero line (DIF -7.12 / DEA -6.81 / MACD -0.62). Buy on a pullback to $620–$640; a break above $670 with strong volume suggests further upside potential.
📅 Earnings Reminder: The next quarter is expected to begin in mid-November 2026, with estimated earnings per share of approximately $5.00.
#DE #NYSE #Industrial #Agricultural #Machinery #FOMC #Earnings #Value #Infrastructure #StockMarket

$SKHY
After the post was published, the stock price rose from the buy point of $138 to the current $160, an increase of over 17%+ 💵💵💵💵💵

🚀 $SKHY — Buy Watchlist
Rebound after testing support level 📈
Price: $136.29
🔥 Resistance: $150 – $160
🎯 Target Price: $180 → $199.87 (Previous High)
💡 Ideal Pullback Range: $132 – $136
🛡️ Support: $124.80 – $133
Price is below the Bollinger Band middle line (164.00) and is testing the $133 support level. The MACD indicator is weak (DIF -11.44 / DEA -7.64 / MACD -7.60). Focus on support first; only small positions are recommended until the price strongly rebounds above $150.
#SKHY #Nasdaq #StockMarket #FOMC #EarningsReport #TechnicalAnalysis #SupportLevels #Momentum #Watchlist #Trading

🚀 $GLW — Buy Watchlist
Pullback to horizontal support level 📉
Price: $124
🔥 Resistance: $140 – $150
🎯 Target Price: $180 → $220 (Previous High $271.78)
💡 Ideal Pullback Range: $120 – $125
🛡️ Support: $115
The middle Bollinger Band (144.38) is only suitable for small-scale entry before $140.
📅 Earnings Warning: Expected EPS of $0.88.
#GLW #NYSE #Materials #Glass #Optical #AI #Datacenter #FOMC #Earnings #StockMarket

🚀 $COHR
The stock rebounded after testing support, presenting an ideal entry point📈
Price: $222
🔥 Resistance: $250 – $275
🎯 Target Price: $320 → $360 (Previous High $440.00)
💡 Ideal Pullback Range: $210 – $220
🛡️ Support: $200 – $215
The price rebounded from the $215 support level (indicated by the blue arrow) below the Bollinger Band middle line (276.13). The MACD indicator is weak (DIF -22.80 / DEA -14.79 / MACD -16.01). We recommend buying on a pullback to the $210-$220 range; a break above $250 with increased volume would be a good entry point.
📅 Earnings Reminder: The next quarterly earnings report is expected to be released in early November 2026, with estimated earnings per share of approximately $1.10.
#COHR #NYSE #Optics #Laser #ArtificialIntelligence #DataCenter #FOMC #EarningsReport #Photonics #StockMarket

🚀 $NET — Buy Watchlist
Pullback to Support Line 📉
Price: $319
🔥 Resistance: $340 – $355
🎯 Target Price: $370.35 → $390 (Previous High)
💡 Ideal Pullback Range: $310 – $320
🛡️ Support: $300 – $315 (Descending Channel Line, Previous Low $158.83)
Price is currently testing the descending channel line, hovering below the Bollinger Band midpoint (332.13). The MACD indicator is weak (DIF -4.85 / DEA -1.61 / MACD -6.48). A pullback to $310–$320 could be a buying opportunity; a break above $340 with significant volume could lead to further gains.
📅 Earnings Reminder: The next quarter is expected to begin in early November 2026, with estimated earnings per share of approximately $0.20.
#NET #NYSE #Cybersecurity #CDN #CloudComputing #ArtificialIntelligence #FOMC #EarningsReport #SaaS #StockMarket

🚀 $SKHY — Buy Watchlist
Rebound after testing support level 📈
Price: $136.29
🔥 Resistance: $150 – $160
🎯 Target Price: $180 → $199.87 (Previous High)
💡 Ideal Pullback Range: $132 – $136
🛡️ Support: $124.80 – $133
Price is below the Bollinger Band middle line (164.00) and is testing the $133 support level. The MACD indicator is weak (DIF -11.44 / DEA -7.64 / MACD -7.60). Focus on support first; only small positions are recommended until the price strongly rebounds above $150.
#SKHY #Nasdaq #StockMarket #FOMC #EarningsReport #TechnicalAnalysis #SupportLevels #Momentum #Watchlist #Trading
🚀 $TXN — Buy Watchlist
Triangle End Convergence 📈
Price: $283.51
🔥 Resistance: $290 – $300 (Upper Triangle Line)
🎯 Target Price: $320 → $334.03 (Previous High)
💡 Ideal Pullback Range: $275 – $282
🛡️ Support: $265 – $275 (Lower Triangle Line)
Price is near the Bollinger Band midpoint ($283.71) and currently at the apex of the triangle. MACD is weak (DIF 2.08 / DEA 3.00 / MACD -1.83). Buy on dips to $275-$282; a break above $300 with significant volume would confirm the breakout signal.
📅 Earnings Reminder: The next quarter is expected to end at the end of October 2026, with estimated earnings per share of approximately $1.50.
#TXN #NASDAQ #semiconductor #analog #artificialintelligence #industrial #FOMC #earningsreport #chip #stockmarket

$CHA
After the post was published, the stock price fell back to the buy point of $11.2, then quickly rebounded, and is currently up over 17% 💵💵💵💵💵


🚀 $CHA — Buy Watchlist
Chagee Holdings stock price rebounded and broke through the moving average 📈
Price: $12.50
🔥 Breakout Target: $12.80 to $13.20
🎯 Target Price: $14.50 → $16.00 (Previous high $16.56)
💡 Pullback Entry Point: $11.20 to $12
🛡️ Key Support Level: $10.20 to $10.80
The stock price has broken through the Bollinger Band middle line ($11.19), and the MACD indicator remains bullish (DIF 0.42 / DEA 0.23 / MACD +0.39). Trading volume is relatively low; let's see if it can break through $13.20 with increased volume. If it pulls back but doesn't fall below $11.20, the overall structure remains bullish.
#CHA #NASDAQ #Tea #Earnings #StockMarket #Trading

🚀 $EUV — Buy Watchlist
Low-Level Rebound 📈
Price: $22
🔥 Resistance: $24.50 – $27.00
🎯 Target Price: $29 → $31.995 (Previous High)
💡 Ideal Pullback Range: $21.00 – $21.80
🛡️ Support: $20.61 (Recent Low)
Price rebounded from a low of $20.61, below the Bollinger Band middle line ($24.50). The MACD indicator is weak (DIF -0.72 / DEA -0.25 / MACD -0.94). Closely monitor the low support; only small positions are recommended until the price strongly rebounds above $24.50.
#EUV #NASDAQ #Materials #RareEarth #FOMC #FinancialReports #Speculation #Mining #China #StockMarket

🚀 $VRT — Buy Watchlist
Rebound after testing horizontal support 📈
Price: $214.61
🔥 Resistance: $230 – $250
🎯 Target Price: $280 → $320 (Previous High $379.94)
💡 Ideal Pullback Range: $200 – $210
🛡️ Support: $190 – $200 (Blue horizontal line, previous low $147.35)
Price rebounded from $200 support, below the Bollinger Bands Midpoint (235.76). MACD is weak (DIF -12.20 / DEA -9.06 / MACD -6.27). Buy on a pullback to $200–$210; a break above $230 with strong volume would target further upside.
📅 Earnings Reminder: The next quarter is projected to end in late October 2026, with expected EPS of approximately $1.00.
#VRT #NYSE #Datacenter #Cooling #AI #Power #FOMC #Earnings #Infrastructure #StockMarket

🚀 $GLXY
Rebounding after breaking below horizontal support 📉
Price: $16
🔥 Resistance: $18.00 – $21.00
🎯 Target Price: $25 → $30 (Previous High $45.92)
💡 Ideal Pullback Range: $15.00 – $15.50
🛡️ Support: $15.03 (Mid-term Low)
Price broke below the Bollinger Band middle line (21.04) and the blue horizontal support level, reaching a low of $15.03. First, observe whether the low holds; it's best to maintain a small position until the price rebounds above $18 with significant volume.
📅Please monitor cryptocurrency prices closely.
#GLXY #NASDAQ #Crypto #Bitcoin #BTC #FOMC #Earnings #Speculative #Mining #StockMarket

🚀 $GM — Buy Watchlist
Retesting the Uptrend Line 📉
Current Price: $78.28
🔥 Resistance: $81.50 – $85.00
🎯 Target Price: $90 → $91.85 (Previous High)
💡 Ideal Pullback Range: $76.00 – $78.00
🛡️ Support: $74.00 – $76.00
The stock price is currently below the Bollinger Band middle line ($81.45) and is pulling back towards the uptrend line (indicated by the blue arrow). The MACD histogram is positive (DIF -0.48 / DEA -0.55 / MACD +0.14). A buy in the $76-$78 range is recommended; a break above $81.50 with increased volume can be used as confirmation of a buy.
📅 Earnings Announcement: The company expects the next quarter to end in October 2026, with estimated earnings per share of approximately $2.40.
#GeneralMed #NYSE #Automotive #ElectricVehicle #ConsumerProducts #FederalOpenMarketCommittee #Earnings #Value #Manufacturing #StockMarket
$HTZ
After the post was published, the stock price fell back to the buy point of $1.80, then quickly rebounded, and is currently up over 27% 💵💵💵💵💵


🚀 $HTZ — Buy Watchlist
Descending Wedge Reversal Pattern 📉
Price: $1.93
🔥 Resistance: $2.15 – $2.50
🎯Target Price: $2.90 → $3.50 (Previous High $8.18)
💡Ideal Pullback Range: $1.70 – $1.95
🛡️Support: $1.45 – $1.55
Price is currently near the Bollinger Band middle line (1.84) and is about to break through. The MACD histogram has just turned positive (DIF -0.04 / DEA -0.08 / MACD +0.08). Low-priced stocks are more volatile; only small positions are suitable until there is a significant breakout above $2.15 with high volume.
#HTZ #NASDAQ #Travel #Automobiles #Leasing #FOMC #Profitability #Speculation #StockMarket #Trading

🚀 $LITE — Buy Watchlist
Pullback to Uptrend Line 📉
Price: $845
🔥 Resistance: $900 – $980
🎯 Target Price: $1,050 → $1,143.00 (Previous High)
💡 Ideal Pullback Range: $790 – $840
🛡️ Support: $780
Price is below the Bollinger Band middle line (982.95) and is testing the uptrend line. MACD is weak (DIF -9.76 / DEA 20.08 / MACD -59.68). Focus on the trend line first; only small positions are suitable until a strong rally above $900 occurs.
📅 Earnings Reminder: Next quarter is expected to begin in early November 2026, with estimated earnings per share of approximately $1.20.
#LITE #NASDAQ #Optical #Networking #AI #Datacenter #FOMC #Earnings #Photonics #StockMarket

$COKE
After the post was published, the stock price fell back to the purchase price of $93, then quickly rebounded, and is currently trading around $210, a gain of nearly 10% 💵💵💵💵💵
The upward trend has not changed, and it is still advisable to consider reducing holdings while continuing to hold.


🚀 $COKE — Buy Watchlist
Retesting the previous high above the upper trendline of the ascending channel 📈
Price: $200
🔥 Resistance: $202 – $205
🎯 Target Price: $210 → $219 (Previous High $218.73)
💡 Ideal Pullback Range: $193 – $196
🛡️ Support: $184 – $188 (Lower Trendline of the Channel)
Price has broken above the Bollinger Band middle line (193.44) and is challenging the upper trendline of the channel. The MACD indicator remains bullish (DIF 2.37 / DEA 1.88 / MACD +0.99). If price breaks above $205 with increased volume, it is expected to challenge the previous high; a pullback to the $193-$196 range could be a buying opportunity. #CocaCola #Nasdaq #ConsumerGoods #KO #FOMC #Mag7 #EarningsReport #Dividends #Defensive #StockMarket

🚀 $CLSK — Buy Watchlist
Retracement to Horizontal Support 📉
Price: $8.9
🔥 Resistance: $10.50 – $12.10
🎯 Target Price: $15 → $18 (Previous High $22.69)
💡 Ideal Pullback Range: $8.50 – $9.00
🛡️ Support: $8.00 – $8.50
Price is below the Bollinger Band Midpoint (12.14) and is testing the $8.50 support level. A downtrend line still exists above. Watch the support level first; only small positions are suitable until a significant volume break above $10.50 is achieved.
📅 Earnings Reminder: Next quarter is expected in early November 2026. Pay attention to Bitcoin price and hashrate
#CLSK #NASDAQ #Bitcoin #Mining #Crypto #BTC #FOMC #Earnings #Energy #StockMarket

🚀 $CEG — Buy Watchlist
Triangle End Convergence 📈
Price: $272.5
🔥 Resistance: $280 – $290 (Upper descending trendline)
🎯 Target Price: $310 → $333.80 (Previous High)
💡 Ideal Pullback Range: $260 – $268
🛡️ Support: $245 – $255 (Lower ascending trendline, previous low $228.63)
Price is hovering below the Bollinger Band Midpoint (273.87), currently at the end of a triangle pattern. MACD histogram is positive (DIF 3.20 / DEA 3.02 / MACD +0.37). Buy on a pullback to $260–$268; a breakout above $290 with significant volume would confirm the breakout.
📅 Earnings Reminder: Next quarter is expected to begin in early November 2026, with anticipated EPS of approximately $3.00.
#CEG #NASDAQ #Utilities #Nuclear #Energy #AI #Datacenter #FOMC #Earnings #StockMarket

$PG
After the post was published, the stock price fell back to the buy point of $145, then rebounded to a high of around $160, a gain of over 15%. 💵💵💵💵💵


🚀 $PG Tracking
Consolidating along the upward trendline 📈
Current Price: 145
Resistance: 148–152, Upside Target: 156 → 167
Ideal Trading Range: 142–144, Key Support: 140–142
Price is hovering around the Bollinger Band middle line at 146.04, and has not yet broken through the trendline. MACD indicator is weak: DIF -0.03, DEA 0.19, MACD -0.45. Buy on dips; if volume increases and the price breaks through 148, it may challenge the previous high.
📅 Earnings report expected in late October 2026, with expected earnings per share of approximately $1.90.
#Procter&G #NYSE #ConsumerGoods #Dividend #Defensive #FOMC #Earnings #ConsumerNecessities #Value #StockMarket
