

U.S. stocks 🇺🇸 | Market trends 📈 | Technical analysis | AI & semiconductors | Sharing daily watchlists, setups & market insights. Not financia
California, USA 🇺🇸
Joined June 2018
- Tweets35.8K
- Following4.9K
- Followers3K
- Likes15K

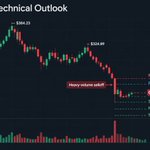




Shakeout or Breakdown? Today's gap down is a live lesson. One of the most important moments in a market correction is when the major indexes approach their 200-day SMA. This is where we often see two very different outcomes: a temporary shakeout that eventually leads to a recovery, or a sustained breakdown that develops into a deeper correction. And the difference between these two scenarios can have a significant impact on how we manage risk and deploy capital. Here's where we stand today: -
$QQQ
: Down 4%, trading near $685 and approaching its 200-day SMA around $680. -
$SMH
: Down 8%, trading near $514 and already below its 200-day SMA around $519. - $VIX: Near 22, up 28% today, but still below its recent spike high around 26. A decline toward the 200-day SMA isn't automatically a sell signal. What matters is how the market responds. Shakeout: (This is what I call a fast death) - Price briefly undercuts the 200-day SMA and reclaims it. - Leading stocks hold their key support levels. - Selling pressure fades, followed by signs of renewed institutional buying. Breakdown: (This is what I call a slow death) - Price loses the 200-day SMA and struggles to reclaim it. - Relief rallies get rejected near resistance. - Lower highs and lower lows develop, accompanied by heavy selling volume. Gap-down day playbook: - Don't make emotional decisions at the open. - Avoid rushing to buy on Day 1. Give the selling pressure time to settle. - Respect your exit rules when leaders break down. - Watch which stocks defend or reclaim their 200-day SMA. - Look for a confirmed follow-through day before increasing exposure. (this is very important) Corrections can eventually create the next generation of market leaders, but not every dip is an opportunity. The difference between a temporary shakeout and a sustained breakdown often becomes clearer with time, price action, and volume. A shakeout can create opportunities, while a sustained breakdown can lead to deeper losses. The goal isn't to predict the exact bottom, but to understand the risks, remain disciplined, and recognize when market conditions begin to improve.

66
🎯 My trading plan for $GOOGL:
🟢 Bullish: Hold $279, reclaim $283.82, then challenge $288.33.
🟡 Neutral: Consolidate between $279 and $283.82 while volume stabilizes.
🔴 Bearish: Break below $279, putting $275 and the $270.70 52-week low into focus.
My opinion: I wouldn't rush to catch this falling knife. The first priority is identifying a stable base and confirming that buyers are returning.
Patience is a trading edge.
Watch price action and volume flows for confirmation.
#GOOGL #TradingPlan #TechnicalAnalysis #RiskManagement #PriceAction #Investing

41

⚡BREAKING: 📷 SpaceX secures a $40 billion GPU financing deal involving Apollo Global Management
$APO
The deal will help SpaceX acquire massive computing infrastructure to support its AI expansion, highlighting the enormous capital requirements of the AI race.

1
38
📈 Friday's market action showed why one red heatmap doesn't tell the whole story.
The latest completed U.S. session on October 23 was mixed: the Nasdaq gained about 0.2%, semiconductor stocks rose roughly 1%, the S&P 500 slipped 0.14%, and the Dow fell about 0.9%.
My take: The tech rebound was encouraging after the previous selloff, but one session doesn't confirm a lasting reversal.
I'm watching market breadth, semiconductor follow-through, and whether major indexes can reclaim resistance and hold it.
The goal isn't to predict every move. It's to recognize when the evidence changes.
#NASDAQ #SP500 #DowJones #Semiconductors #MarketRecap #WallStreet
📊 My $ORCL game plan: Trade the levels, not the emotion.
🟢 Bullish scenario: Break above $128.33 and hold, with stronger buying participation.
🟡 Neutral scenario: Consolidate between $124.40 and $128.33 while the market looks for direction.
🔴 Bearish scenario: Lose $124.40 and fail to recover, putting the $120-$122 area back in focus.
My opinion: Oracle's rebound is worth watching, but the broader downtrend means risk management still matters. I'd rather wait for a clear setup than chase a quick move without a plan.
Stay patient. Protect your capital. Let the chart confirm the trade.
#ORCL #TradingPlan #RiskManagement #TechnicalAnalysis #AIStocks #WallStreet

1
3
206
🎯 Here's my technical roadmap for $MRVL.
The chart is showing a recovery attempt after a major pullback, so these are the levels I'm watching:
🔴 $231.62: First resistance
🔴 $240 to $245: Next resistance zone
🟢 $221 to $224: Near-term support
⚠️ Below $221: Downside risk increases, with $200 to $210 worth monitoring
My opinion: A clean breakout above $231.62, followed by a hold, would improve the short-term setup. A rejection at resistance could keep MRVL stuck in a volatile range.
I prefer confirmed price action over trying to predict the exact bottom.
#MRVL #PriceAction #TechnicalAnalysis #TradingLevels #ChipStocks #Investing

79
🎯 My $MU game plan: Stay disciplined and let the chart confirm the next move.
Based on the October 23 intraday snapshot, Micron was trading near $883.70, up 3.18%, with a session range of $858.34-$891.89.
🟢 Bullish scenario: Break above $891.89, reclaim $900, and hold with convincing volume.
🟡 Neutral scenario: Consolidate between support and resistance while the market looks for direction.
🔴 Bearish scenario: Lose $856-$858 and fail to recover, putting lower support zones back in focus.
My view: The rebound is worth watching, but I won't confuse a strong session with a confirmed reversal. I want a clear entry, a defined risk level, and a plan for either outcome.
Trade the setup, not the emotion.
#MU #TradingPlan #RiskManagement #TechnicalAnalysis #Semiconductors #WallStreet

1
35
🎯 My $SOXL game plan: Trade the setup, not the emotion.
At the time of the October 23 screenshot, SOXL was around $85.61, up 4.26%, with an intraday range of $80.83-$87.61.
🟢 Bullish scenario: Break above $87.61 and hold, with volume confirming the move.
🟡 Neutral scenario: Stay between support and resistance while the market searches for direction.
🔴 Bearish scenario: Lose $80.83 and risk revisiting the $80.22 swing-low area.
My view: The rebound is promising, but SOXL's 3x daily leverage makes position sizing and risk limits essential. I won't treat a sharp bounce as permission to ignore downside risk.
Plan the trade before the trade tests you.
#SOXL #RiskManagement #TradingPlan #TechnicalAnalysis #DayTrading #Semiconductors

104
🎯 My $INTC watchlist plan for the next move.
Current reference: Around $86.57 in the October 23 morning session, up 1.26% at the time of the screenshot.
🟢 Bullish scenario: Hold $84.70-$85, break $86.81, and reclaim $88 with convincing volume. Then I'll watch the $90-$93 area.
🔴 Bearish scenario: Lose $84.70 and fail to recover. The prior low near $81.79 becomes the next major reference.
⚪ Neutral scenario: Stay trapped between support and resistance, with no clear confirmation.
My approach is simple: Define risk before entering, avoid chasing emotional moves, and let price confirm the setup.
The goal isn't to predict every candle. It's to manage risk and trade with a plan.
#INTC #TradingPlan #RiskManagement #TechnicalAnalysis #Stocks #WallStreet

29
Moderna's long-term cancer vaccine opportunity is worth watching, but the short-term chart is damaged.
At the latest screenshot, $MRNA was around $193.06 premarket, down 4.72%. I’m watching three things: whether $190 holds, whether $180.80 gets retested, and whether price can reclaim $200-$203 with stronger buying volume.
My rule: let price action confirm the setup. High volatility creates opportunity, but it also demands risk management.
#MRNA #Moderna #TechnicalAnalysis #BiotechStocks #Trading

37
🚨 WALL STREET CLOSE: Tech took a serious hit today.
📉 Nasdaq Composite: -2.58% to 26,008.86
📉 S&P 500: -1.19% to 7,664.77
📈 Dow Jones: +0.03% to 52,873.60
My take: This wasn't a uniform selloff. The biggest pressure came from technology and AI-related stocks, while the Dow held up much better.
Technically, I'm watching whether the Nasdaq can stabilize after this sharp decline. If sellers remain in control and rebounds fail near intraday resistance, downside risk remains elevated. I want confirmation before buying the dip.
#StockMarket #WallStreet #Nasdaq #SP500 #DowJones #MarketOutlook #Investing

1
1
26
⚠️ Is $INTC setting up for a bounce, or is another leg down coming?
Here's what stands out:
🔻 Last price: $86.71, down 6.72%
📉 Previous close: $92.96
📍 Intraday range: $86.66 to $89.19
📊 Volume: Approximately 39.03 million shares
The order-book snapshot also shows 67.10% sell-side versus 32.90% buy-side, although those figures can change quickly and don't represent confirmed money flows.
My take: The chart still favors caution. A reclaim of $89.19 would improve the short-term picture, while a sustained break below $86.66 would raise the risk of a move toward $81.79.
I'll wait for confirmation instead of guessing the bottom. Risk management comes first.
#INTC #SemiconductorStocks #StockTrading #TechnicalAnalysis #MarketOutlook #Stocks #Investing

50
🔎 Here's what I'm watching ahead of today's U.S. market open:
$NVDA: Can buyers defend the AI leadership trade?
$MU: Will semiconductor selling stabilize?
$AMD: Can price action recover after heavy pre-market pressure?
$AMZN: Will weakness in mega-cap tech continue?
$TSLA: How will the market respond to its spending outlook?
My personal take: Today's weakness could create opportunities, but a lower opening price alone is not a buy signal. I'll look for improving volume, a stronger opening range and a reclaim of VWAP before turning constructive.
Trade the setup, not the headline. Manage risk first.
#NVDA #TSLA #MU #AMD #AMZN #INTC #EarningsSeason #TechStocks #PreMarket #Investing

69
🎯 My market watchlist after Wednesday's close:
The Nasdaq finished up 1.05%, the S&P 500 gained 0.58%, and the Dow advanced 0.69%.
Here's my technical checklist for the next session:
📈 Bullish signal: Follow-through buying in tech and semiconductors, supported by stronger volume.
⚠️ Warning sign: A failed breakout or a sharp reversal after today's rally.
📊 Key confirmation: Continued Nasdaq leadership and broader participation across sectors.
My opinion: Momentum favors the bulls for now, but confirmation matters. I'll avoid chasing extended moves and focus on price action, volume, and risk management.
#TechnicalAnalysis #PriceAction #MarketMomentum #SP500 #Nasdaq #DowJones #Resistance #Support #RiskManagement #StockTrading

1
33
🎯 My $SOXL game plan is simple: let price confirm the next move.
Latest snapshot: $103.43, up 6.03%.
📈 Bullish scenario: Break above $104.96 with stronger volume, then watch $110–$120.
↔️ Neutral scenario: Consolidate between $99.31 and $104.96 while the market establishes direction.
📉 Bearish scenario: Lose $99.31 and watch the $91.35–$95 zone for potential support.
The displayed order book showed 75.51% on the sell side versus 24.49% on the buy side. That's only a snapshot, not a reliable standalone prediction.
My view: I won't chase a sharp rally without confirmation. With 3x daily leverage, protecting capital is essential.
#SOXL #TradingStrategy #RiskManagement #TechnicalAnalysis #Stocks

2
162
$BTC is pushing toward $85K again, up 2.71% to $84.7K. Bulls are gaining momentum, but the real test is still ahead.
🎯 Resistance: $87.4K
🛡️ Support: $83K
My take: A clean breakout above $87.4K with strong volume could open the door to another leg higher. Until then, confirmation matters more than hype.
#Bitcoin #BTC #Crypto #Trading

1
26
🎯 My $MU game plan is simple: let price confirm the next move.
Latest snapshot: $919.685, up 2.64%.
📈 Bullish scenario: Break above $928.45 with stronger volume, then watch $950–$970.
↔️ Neutral scenario: Consolidate between $889.45 and $928.45 while buyers and sellers find balance.
📉 Bearish scenario: Lose $889.45 and watch the $860–$880 area for potential support.
The displayed order book showed 63.16% buying versus 36.84% selling, but that's only a snapshot, not a guarantee of future direction.
My take: I won't chase price without confirmation. Protecting capital is part of the strategy.
#MU #TradingStrategy #RiskManagement #TechnicalAnalysis #Stocks

1
40
This week I'm starting something that's gonna change a lot of people's lives. Last challenge: started with $5,000, goal was $50k in one month. Hit it. Doing another round this week, same rules. Limited spots. Still $5,000 in, one month, $50k target. Not promising everyone will hit it. But last time we did. Want in? Reply Join and follow me, I'll DM you. Closes when it's full.

36