

The hardest one is usually the first: People regret not living their own life.
California
Joined October 2011
- Tweets3.6K
- Following5.5K
- Followers476
- Likes53.5K


Fedvity(Patient&Discipline) retweeted

The early day rally in $SPY without first undercutting yesterday’s low looks suspicious to me. I doubt it holds without at least an undercut and some additional downside testing.
But in all honesty, with my stops now at breakeven and zero risk on my shorts, if you gave me a choice between getting stopped out at breakeven and keeping the bull market alive, or making a quick profit while the market enters a prolonged bear market, I’d choose to get stopped out - nothing gained, nothing lost.
Why?
Because there are much bigger, and far more numerous opportunities in individual stocks during a healthy bull market than there are from profiting on a quick index short trade.
I’m positioned to profit if the market continues lower, but I’m certainly not rooting for it. Give me a healthy bull market with a broad field of quality setups... that’s where the real money is made.

Fedvity(Patient&Discipline) retweeted
When you fail to respect risk, you will win some battles, but you will lose the war.
At times, you’ll look like a genius. Over time, you’ll be proven a fool.
This I can gaurantee.

Fedvity(Patient&Discipline) retweeted

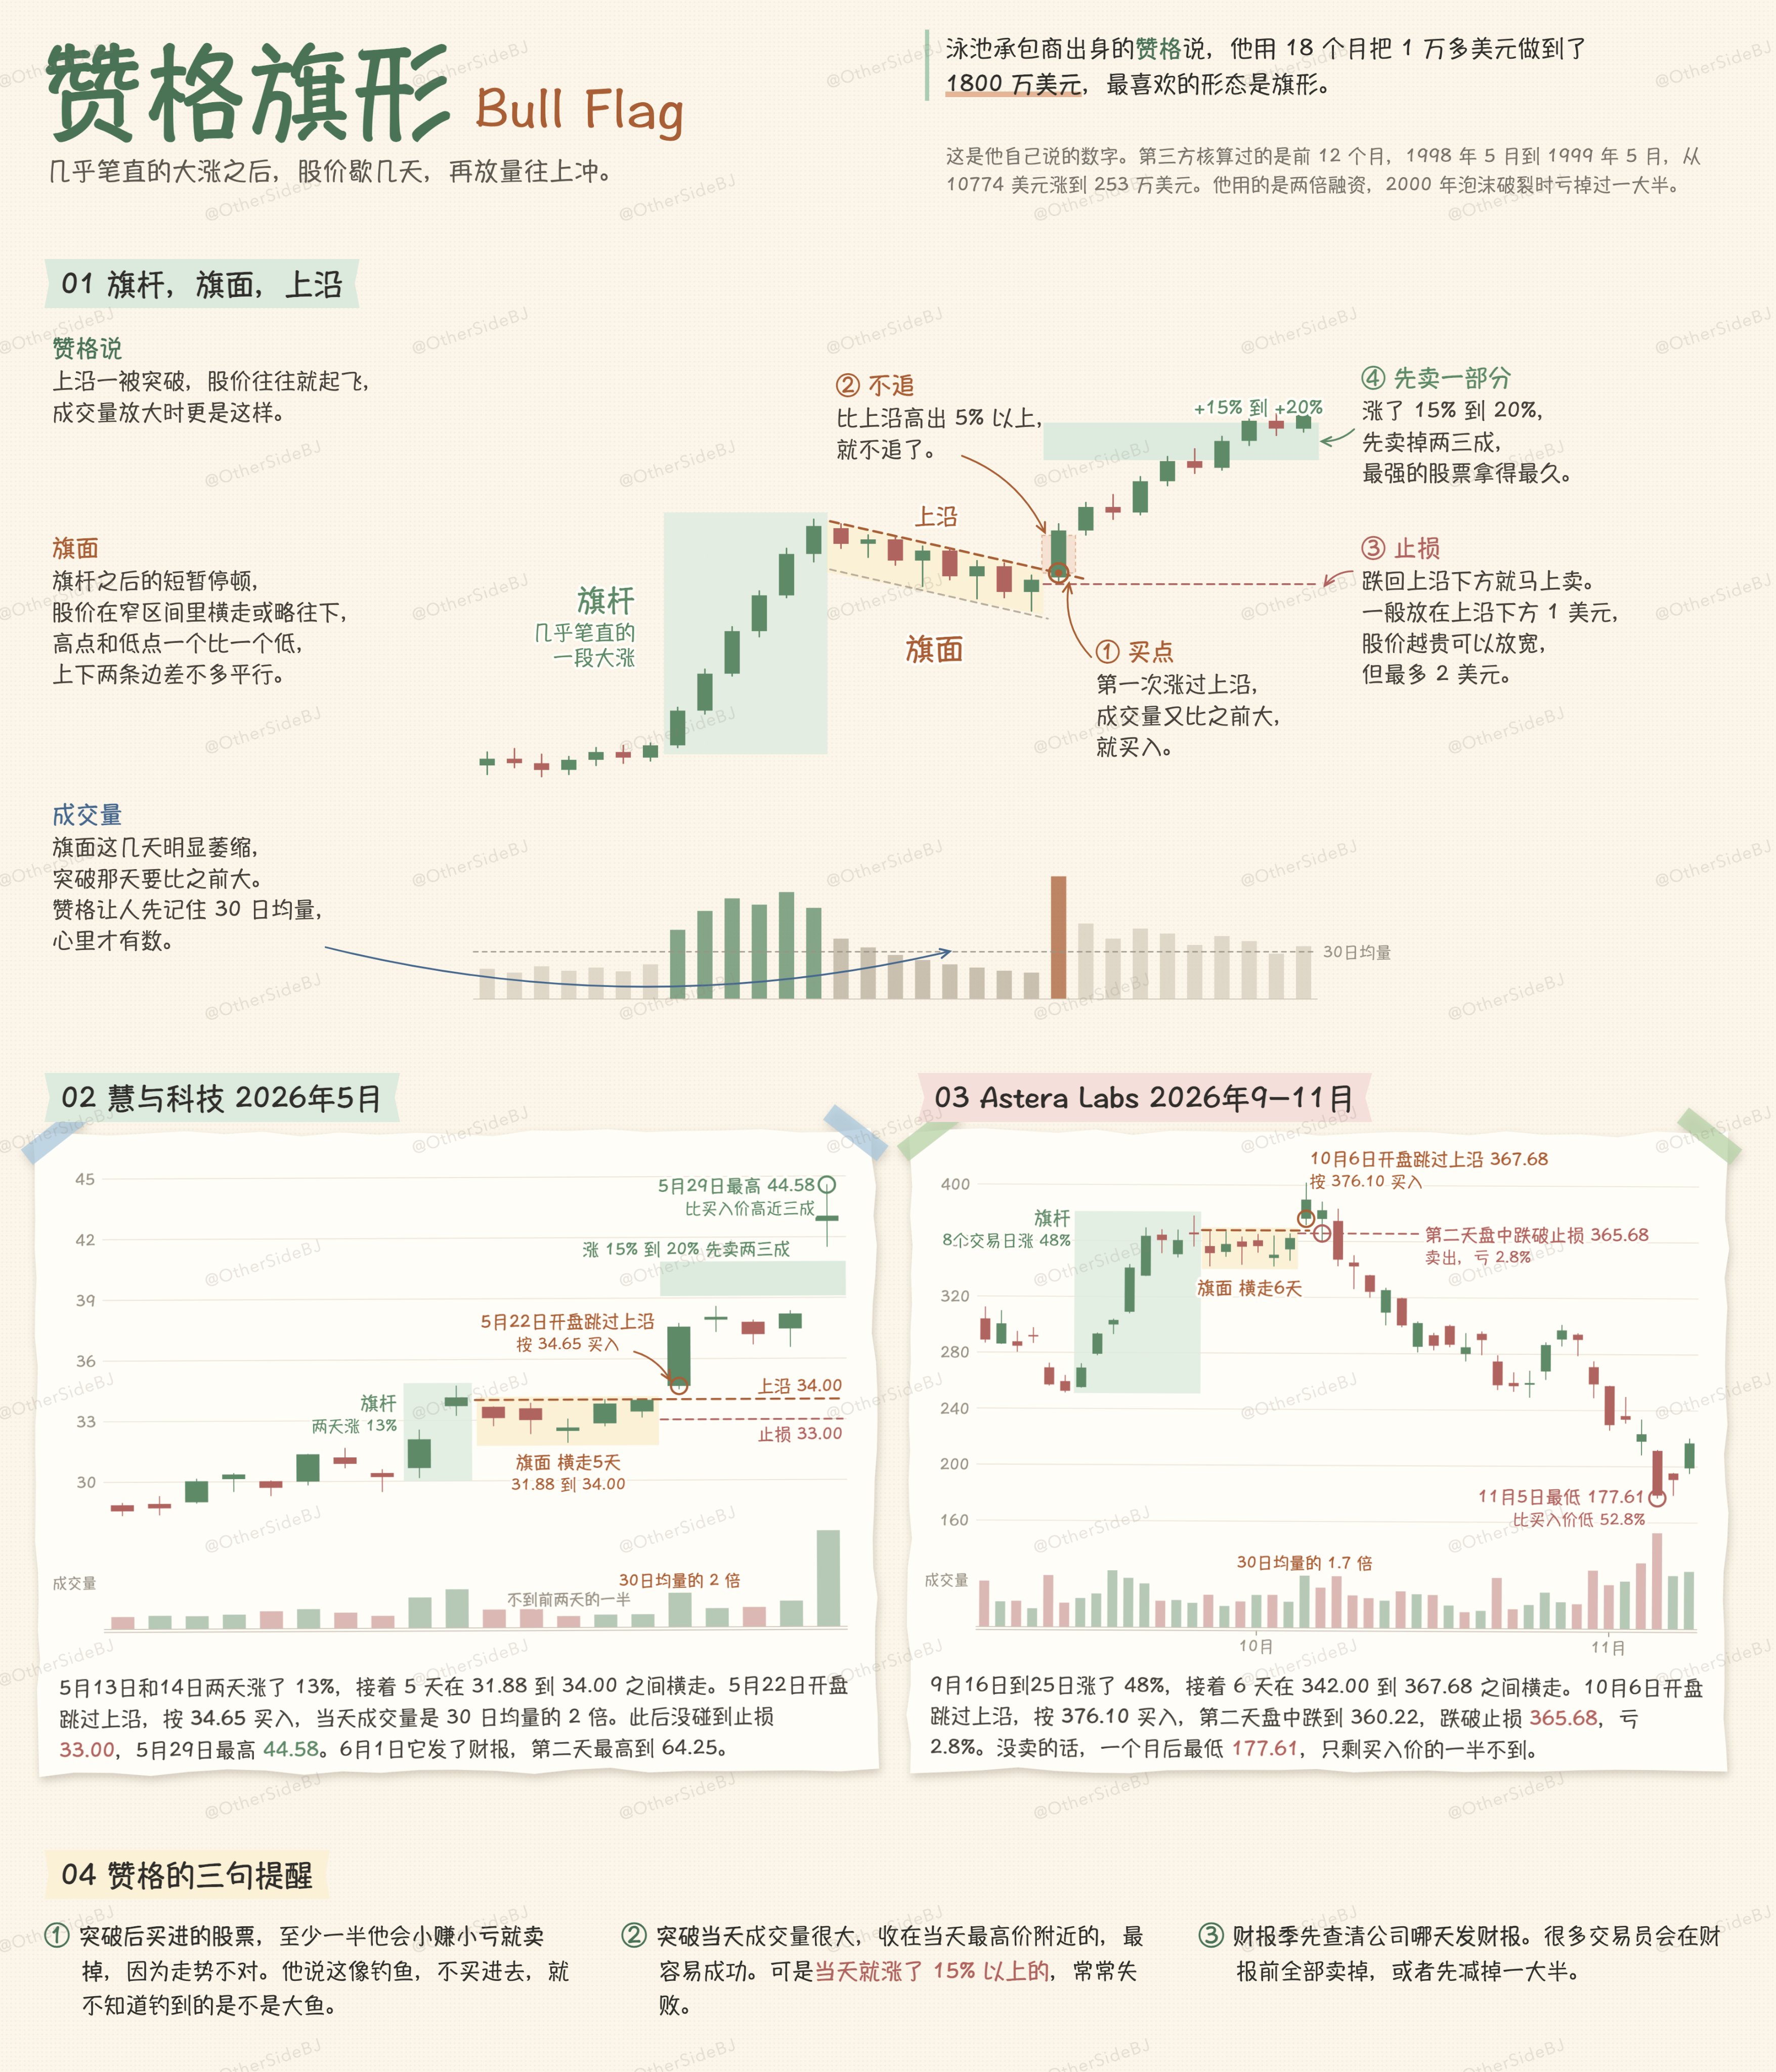
泳池承包商出身的丹·赞格,用18个月把1万多美元做到了1800万美元。
他最喜欢的形态是旗形。
旗形是股价几乎笔直地大涨一段,像旗杆,接着在窄区间里横走或略微往下几天,像旗面,成交量变小。
赞格说,股价一涨过旗面的上沿,往往会接着大涨,成交量放大时更是这样。
他的做法是,股价第一次涨过上沿,而且成交量放大,就买入,高出上沿5%以上就不追,止损只放在上沿下方1到2美元,股价越高放得越宽。
今年5月,慧与科技两天涨了13%,接着在31.88到34.00美元之间横走了5天,成交量不到前两天的一半。5月22日它开盘跳过上沿,按34.65买入,止损33.00,当天成交量是过去30天平均的2倍。
一周后它最高涨到44.58,比买入价高了近三成。
芯片公司Astera Labs则是一次失败的突破。
它9月中下旬涨了48%,横走6天后,10月6日开盘跳过上沿,成交量同样放大,按376.10买入,止损365.68,第二天盘中就跌破了,亏2.8%。
此后一个月最低跌到177.61,比买入价低了一半多。
赞格说,突破时买进的股票,至少一半他会小赚小亏就卖掉。止损紧贴上沿,失败时亏的是Astera Labs那样的2.8%,成功时赚的是慧与科技那样的近三成。
Fedvity(Patient&Discipline) retweeted
Bottom Fishers Beware!
Technology is extremely oversold, and that is a tempting condition for bottom fishing crowd. The Technology sector trailed the S&P 500 by 11.8% over the 21 trading days ending November 5, marking its worst relative drawdown since 2001. However, Technology’s oversold condition is no guarantee that a sustainable bottom is near. If history is a guide, volatility is more likely than a sustained alpha producing period.
The chart below plots every occurrence that Technology underperformed the S&P 500 by more than 10% over 21 days since 1990. While several cases were followed by short-term bounces, most were fleeting, with the average case drifting lower for three months. The biggest exception was 2002, when Technology saw a quick recovery following a selloff associated with the dot-com bust.
While every cycle plays out differently, history suggests that a sustainable relative strength bottom may take time to develop.
minervini.com

Fedvity(Patient&Discipline) retweeted

100万美元组交易双冠王就是他。
香港教师J Law转行做交易员后天赋就全出来了,把100万美元两年做到1600万,拿下美国投资锦标赛100万美元大级别组二连冠,还破了Mark Minervini的盈利纪录🥸🫡
绝了这个!!
他用的就是 Minervini 提出来的 VCP 策略,还上过 Minervini 的课,算是名师高徒,比赛那两年他在VCP上又加了几个条件,他爱人用的也是这套拿了同组的亚军,这你受得了吗,接下来我就说一下他这套VCP策略。
他交易的逻辑是等想卖的人基本卖光了再买。
一只股票涨了一大段以后,低位买的人想获利,高位追进去被套的人,一回本就想走,所以股价会一波一波的回调,但每回调一次,想卖的人就少一批,所以回调一次比一次浅,成交量也越来越小。
等到没什么人再卖,只要有买盘进来,价格就很容易涨上去,VCP 叫波动收缩形态,找的就是这个时候,看视频吧,说的很全!!
Fedvity(Patient&Discipline) retweeted
美国交易员Ross Cameron从一个583美元的小账户做起,到现在累计赚了2000多万美元。
今年6月,美国把日内交易的门槛从2.5万美元降到了2000美元,他马上把账户重置成2000美元从头再做,没有借一分钱杠杆,46天又做到了10万美元以上。
他两次用的都是同一套动量交易策略,每天早上用五条标准挑出涨得最猛的小盘股,等它第一次回调再买进,进场前就定好最多亏多少。
这套方法押的是供需失衡。
小盘股能自由买卖的股票本来就少,一条利好新闻引来大批散户抢筹,股价一个早上就能翻倍。
Ross Cameron只做已经涨起来,全市场都在盯的那一只,快进快出。
他每天的交易分三步:选股,找买点,出场。
下面就用这次挑战的最后一天,账户越过10万美元的那一笔ZTG,把三步走一遍。

Fedvity(Patient&Discipline) retweeted
With millions of people on Twitter, every day someone makes a prediction or a “market call.” And out of all those people, every day SOMEONE is going to be right.
It’s like the lottery. Every week there’s a winner—but every week the name is different.
I’ve been succeeding in the stock market for 43 years. Not because I was a natural-born trader, and certainly not because I can predict the future. It’s the result of practice, study, discipline, patience, strategy, rules, experience—and being smart enough to never allow a prediction to get in the way of my respect for risk.
My entire fortune has been built on three key rules:
1. I never buy at the bottom.
2. I always sell too soon.
3. I never hold or add to losses.
That’s how you survive long enough to build a generational fortune. And for those smart enough to heed its wisdom, this tweet is worth a fortune.
Fedvity(Patient&Discipline) retweeted
从 Martin Luk 这种交易新秀,到 Mark Minervini,Larry Williams 这种顶级老交易员。
他们的看家方法,TradingView 上都有人做成了免费指标。
下面这 8 个,每个都附上了搜索名,搜到直接添加就可以使用。
以 969.8% 的年收益拿下 2025 年美国投资锦标赛冠军的 Martin Luk,常用一条平均成本线,算的是从波段高点开始买进的人平均花了多少钱。
搜索 Auto Anchored Swing VWAP,这条线会自动画好,出了新的高点还会自动重画。
2020 年以 941.1% 的年收益夺冠的 Oliver Kell,最经典的形态叫 Wedge Pop,就是股价急跌之后,第一次重新站回均线。
搜索 Wedge Pop,图上会自动标出 WP。涨得太猛之后第一次跌回均线,也会标出 WD。
两次拿下美国投资锦标赛冠军的 Mark Minervini,选股第一步是用他的趋势模板,把不在上升趋势里的股票先筛掉。
搜索 Mark Minervini,符合模板的股票会自动标出绿色。
一年把 1 万美元做到 110 万美元以上的 Larry Williams,发明过一个公式,能给任何品种算出它自己的恐慌指数。
搜索 CM_Williams_Vix_Fix,选作者 ChrisMoody 的那个。柱子变绿,说明这次的恐慌已经明显超过平时。
一年赚了 1400 多万美元的 Dan Zanger,最喜欢找放量突破的股票。
搜索 Zanger Volume Ratio,它会在盘中告诉你,今天到现在的成交量是平常同一时间的几倍,超过 2 倍柱子就变红。
《笑傲股市》的作者威廉·欧奈尔,给所有股票按过去一年的涨幅打 1 到 99 分,叫 RS 评分。
搜索 RS Rating,任何一只股票都能算出这个分数,常见的参考是 80 分以上。
箱体理论的创始人达瓦斯,原本是个职业舞蹈演员,趁巡演空档炒美股赚了 200 万美元。
搜索 Darvas box,强势股横盘的那一段会被自动画成箱子,向上突破箱顶,就是他买进的位置。
赚了 3000 多万的美国交易员 JadeCap,每天开盘前要先标出前一天和亚盘时段的高点低点。
搜索 ICT Killzones,这几条线会自动画好,哪条已经被价格碰过,一眼就能看出来。它更适合纳指期货和比特币这类夜里也在交易的品种。
不知道从哪个开始,可以先挑一个和自己的交易习惯最像的,加到手里的股票上,看看它过去标出来的位置准不准。


Fedvity(Patient&Discipline) retweeted

给文盲们科普一下,只有地中海气候的城市才适合人类生活,非地中海气候只能叫生存。
以下是地中海气候城市排行榜:
欧洲四个。
罗马 (意大利) - Csa型。夏季均温约 25°C,冬季均温约 8°C,年均降水量约 800mm。
雅典 (希腊) - Csa型。夏季均温约 28°C,冬季均温约 10°C,年均降水量约 400mm。
巴塞罗那 (西班牙) - Csa型。夏季均温约 24°C,冬季均温约 10°C,年均降水量约 600mm。
特拉维夫 (以色列) - Csa型。夏季均温约 27°C,冬季均温约 14°C,年均降水量约 530mm。
北美两个。
洛杉矶 (美国) - Csb/Csa型(受微气候影响)。夏季均温约 24°C,冬季均温约 14°C,年均降水量约 370mm,降水高度集中在冬季。
旧金山 (美国) - Csb型(凉夏地中海)。受到寒流影响,夏季均温约 18°C,冬季均温约 11°C,年均降水量约 600mm。
南美两个。
南美洲西海岸
圣地亚哥 (智利) - Csb型。夏季均温约 22°C,冬季均温约 9°C,年均降水量约 340mm,旱季可长达5个月以上。
瓦尔帕莱索 (智利) - Csb型。夏季均温约 18°C,冬季均温约 11°C,年均降水量约 370mm。
非洲一个。
开普敦 (南非) - Csb型。夏季均温约 22°C,冬季均温约 13°C,年均降水量约 510mm。
澳洲两个。
珀斯 (澳大利亚) - Csa型。夏季均温约 24°C,冬季均温约 13°C,年均降水量约 730mm。
阿德莱德 (澳大利亚) - Csa型。夏季均温约 23°C,冬季均温约 12°C,年均降水量约 540mm。
移民生活旅游,我现在只考虑去这些城市吃喝玩乐生活定居。
大家可以纳入收藏,等你真正体验过什么叫地中海气候。
你才知道,卧槽天气好原来可以这么爽,我他妈那么多年原来都是在受苦受难啊,我他妈以前过的那叫什么人过的日子?!

Fedvity(Patient&Discipline) retweeted
瑞典交易员Kristjan Kullamägi,用当保安攒下的5000美元开始炒美股,爆仓三次后把账户做到了1亿美元以上。
2021年,他一年炒股赚了约4200万美元,收入排瑞典全国第15,比Spotify的创始人还多。
今年他也被《金融怪杰》作者施瓦格写进新书的第一章,这绝对是目前最顶级的交易员没有之一。
Kullamägi最常用的策略是Breakout强势股突破。
他只做最近几个月最强的股票,在它整理完再次突破的那天买入,止损放在当天最低点,规则非常简单清晰。
接下来我就结合实例,把Kullamägi的强势股突破策略介绍给大家。

Fedvity(Patient&Discipline) retweeted
I don't think we're going to see an '87-style crash in percentage terms, but today could set the stage for some form of market meltdown that could potentially last a week or two. If the decline picks up steam, throw your oversold indicators out the window. My guess would be $SPY 10%-15% from peak with 20% as a worst case. Nasdaq could drop 20-25%. Possible 1998 cyclical bear market.

Fedvity(Patient&Discipline) retweeted
The midterm election delivered a considerably stronger Democratic showing than the market was anticipating. Democrats captured both the House and Senate, with gains extending well beyond the traditional battlegrounds and into states and districts that had been reliably Republican. The result is a genuine blue wave and, from the market's perspective, the important issue this morning isn't politics -- it's surprise. Markets can discount good news and bad news; what they have a more difficult time discounting is an outcome that wasn't fully anticipated.
Historically, that reduction in legislative flexibility has not necessarily been a negative for stocks. Markets generally prefer predictability, and divided government can make sweeping changes in taxes, spending and regulation more difficult to enact. Fidelity's research makes an important point: historically, the market's post-election behavior has been driven less by which political party won than by the reduction in uncertainty once the election was over. As Fidelity puts it, the environment doesn't necessarily become completely clear - it simply becomes “less unclear.” And this is where the historical picture becomes particularly interesting.
Since 1938, the S&P 500 has been higher 95% of the time during the 12 months following a midterm election, with an average gain of approximately 14%. Fidelity's longer-term work on the presidential cycle also shows the post-midterm year as historically the strongest portion of the four-year election cycle. Schwab finds a similar pattern: since 1974, the S&P 500 has averaged a 5.7% gain in the three months following midterms and 12.4% over the following six months.
That historical tendency is reinforced by seasonality. We have now entered what has traditionally been the strongest six-month period of the year, November through April. Since 1945, the S&P 500 has averaged roughly 7% during that six-month stretch versus just over 2% from May through October. November itself has historically been one of the market's strongest months, and the November through January period has also been particularly favorable
So we now have several potentially favorable historical forces beginning to converge: the election is behind us, political uncertainty has been reduced, Washington is moving toward divided government, we're entering the historically strongest part of the presidential cycle, and we're simultaneously moving into one of the strongest seasonal periods of the year.
That does not mean the market has to go straight up from here. In fact, given the magnitude of the election surprise, some additional volatility would not be unusual. The market still has to digest what the Democratic Congress could mean for taxes, regulation, AI infrastructure, energy policy and other areas. More importantly, the election doesn't make the other risks disappear. The 10-year Treasury yield remains near 5%, oil remains above $100, inflation and Fed policy remain significant issues, and questions surrounding AI valuations and capital spending are still very much in play. Those fundamental forces ultimately matter more than the election itself.
What matters now is whether the tape begins to confirm the historical script. I want to see the major indexes absorb the election shock and hold support, but even more important, I want to see improvement beneath the surface: broader participation, expanding leadership, more stocks reclaiming key moving averages, fewer new lows, more quality setups and, ultimately, breakouts that can gain traction and hold their gains.
Encouragingly, breadth has already improved, with nearly two-thirds of S&P 500 stocks moving above their 10-week averages after starting the month at only about 20%.
The bottom line is that the election result may have been more dramatic than investors expected, and the market's initial volatility reflects that surprise. But the election also removes a major uncertainty, creates divided government and places us directly into a historically favorable post-midterm and seasonal window. If the market needs to shake out further in the near term, I would not automatically interpret that as bearish. It could be part of the process of discounting the new political reality and establishing a more durable low.
Of course, the historical and seasonal backdrop doesn't guarantee the outcome. Stock setups will be our main focus. In the meantime, our shorts act as a hedge, and as always, our longs are protected with stops.
minervini.com




Fedvity(Patient&Discipline) retweeted
打破了Mark Minervini的收益记录,两年总收益接近1500%的香港小伙J Law,筛股票时最先看的就是RS线。
这条线在TradingView上不用装任何指标,在代码框输入 NVDA/SPY,回车就能画出来。
RS线就是拿个股的价格除以大盘,NVDA/SPY 就是英伟达除以标普500 ETF。
线往上走,说明它比大盘强,往下走,说明它比大盘弱。 很多人会把它和RSI搞混,其实是两回事。
RSI只看这只股票自己,RS线是拿它和大盘比。
在这条线上再加一条21日的EMA均线,在指标里搜 EMA,把长度改成21就行。
RS线一直在均线上方,说明这只股票一直比大盘强,大盘在跌,RS线却还能创新高的,最值得关注。
比如图里的Netflix。
2025年4月关税暴跌,4月8日标普离高点已经跌了18.8%,Netflix的股价离高点也还差17.8%。
但它的RS线在这一天已经创了新高。 半个多月后,4月24日,股价也创了新高。
之后3个月涨了48%,同期标普涨了25%。
不过RS线创新高,只说明它比大盘抗跌,不代表它不会跌。
另一个UnitedHealth,同一天RS线也创了新高,9天后发财报,一天跌了22%,到5月中股价几乎腰斩。
所以RS线只是帮你把强势股挑出来,买不买,还要看股价自己的走势。
免费账户在日线,周线和月线上都能用这个比值图,日内周期需要付费。
科技股也可以除以QQQ,就是和纳指比。
下次大盘大跌的时候,可以把手上的股票都除以SPY看一看,谁的RS线先创新高,谁在这波下跌里就最抗跌。


香港中学语文老师J Law,两次夺得美国投资锦标赛100万美元以上股票组冠军,打破了Minervini创下的收益记录。
两年总收益1499%,同期标普只涨了约47%。
J Law选股只走一条固定流程,每个周末做一遍,下周做哪几只,什么价位进场,周一开盘前就定好了,五步就能讲明白。
第一步,复盘手上的股票。
把每只持仓上一周涨跌了多少看一遍,再和大盘放在一起比,如果它涨得还没大盘多,赚到的可能只是大盘的钱。
有股票在跌,拿不准要不要卖,就问自己:
如果现在手上是现金,还会按这个价买它吗?
然后再看四样:还有没有上涨的势头,跑不跑得赢大盘,走势正不正常,图上有没有买盘托着。
答案是否定的,就卖掉,把钱和精力留给更强的股票。


