

I have some amazing health products to lose and gain weight, to strengthen your immune system and to detox your body click the link in my bio for more details
Montego Bay, Jamaica
Joined May 2017
- Tweets22.1K
- Following1.6K
- Followers246
- Likes28.2K


Nevada Morgan retweeted

BUNNY SHAW HAT-TRICK 😱🚨
Shaw's third of the afternoon makes it 5-0 to City! 🔥
#BarclaysWSL | @ManCityWomen
Nevada Morgan retweeted

Hurricane Melissa’s Jamaica Landfall: What Does the Late-Cycle Data Actually Show?
The difference between the official landfall intensity and the estimate developed here is the direct result of examining observations the Tropical Cyclone Report did not analyze in detail. In it, the Jamaica intensity section notes the lack of late reconnaissance and the degraded satellite presentation, then applies only a very slight reduction from the earlier peak. It doesn’t test or explain the measured pressure rise between the final two center fixes, the New Hope and Crawford surface readings against the near-flat inner-eye structure documented by reconnaissance, or the gradients and observed conditions those readings actually require. The following analysis performs that crucial examination. It evaluates the respective surface observations against three realistic center positions and three assumed landfall pressures (and their time-adjusted equivalents), showing which values are consistent with the reported winds, weather, and pressure changes inside the eye. This allows any reader to check the results directly against the actual surface observations.
How to read the pressure gradients
In a #hurricane, the lowest pressure is found at the center (eye). As you move outward from there, the pressure rises. The rate of that rise — the pressure gradient — is measured here in millibars per nautical mile (mb/n mi).
* Calm eye: ≤1.5 mb/n mi — light or calm winds
* Inside the eye (lull): 1.5–3 mb/n mi — still inside the eye but outside the calm core; winds no longer light
* Inner edge: 3–4 mb/n mi — transition zone where the slope steepens and conditions begin to change significantly
* Eyewall: ≥4 mb/n mi — steepest gradients and strongest winds
A normal pressure profile is parabolic: meaning it’s flattest near the center, then steadily steeper with distance until the eyewall, after which it relaxes again. When a proposed central pressure forces the gradient to be steeper closer to the center than farther out, or requires eyewall-level slopes inside a documented calm eye, the value is physically unrealistic.
These ranges reflect the steep gradients of a small, intense core like Melissa’s; a larger, weaker system would show lower absolute values while retaining the same relative structure.
The blocks that follow simply apply this test at successive times using the measured station pressures and the known conditions at each site. The results show that only a landfall pressure of 910–912 mb keeps every gradient inside the range that matches the observed eye, eye-edge, or eyewall location.
The blocks begin with the 1725Z landfall as the primary test, then step back to 1720Z and 1700Z to establish the filling already underway on final approach. The sequence then proceeds chronologically through the post-landfall periods.
1725Z — Landfall
Sandals South Coast was inside the calm eye, and Crawford was on the inner edge with conditions already improving. The refined track is the primary position. Sandals is shown as the reasonable northernmost point that still rounds to the official 18.1°N, 78.0°W coordinate and remains inside the original radar-derived corridor. All positions lie within 1.5 n mi of one another.
Reanalyzed Intensity: 150 kt/912 mb
(Plausible floor down to 910 mb)
Refined track— 18.104°N, 77.981°W
* Sandals: 0.54 n mi
* New Hope: 0.96 n mi | 912.3–913.4 mb → 0.3–1.5 mb/n mi
* Crawford: 5.39 n mi | 933.5 mb → 3.99 mb/n mi
Sandals (northern limit) — 18.108°N, 77.989°W
* Sandals: 0.00 n mi | 912.0 mb → 0.00 mb/n mi
* New Hope: 1.48 n mi | 912.5–914.2 mb → 0.3–1.5 mb/n mi
* Crawford: 5.92 n mi | 933.5 mb → 3.63 mb/n mi
Original radar-derived — 18.095°N, 77.975°W
* Sandals: 1.13 n mi
* New Hope: 0.35 n mi | 912–912.5 mb → 0.0–1.5 mb/n mi
* Crawford: 4.8 n mi | 933.5 mb → 4.48 mb/n mi
The refined track is the original radar-derived coordinate shifted 0.62 n mi north-northwest. It is the preferred position because it is the minimal continuous adjustment of the radar track that also places Sandals well inside the observed calm eye. Even when the center is placed directly at Sandals (the northern limit), the gradient on the eye floor remains well below the 1.5 mb/n mi calm-eye ceiling under a 912 mb central pressure.
Sensitivity (refined-track distances, fair eye-floor pressures)
* 912 mb center (New Hope 912.5 mb): New Hope → 0.52 mb/n mi | Crawford → 3.99 mb/n mi
* 909 mb center (New Hope 909.5 mb): New Hope → 0.52 mb/n mi | Crawford → 4.55 mb/n mi
* 906 mb center (New Hope 906.5 mb): New Hope → 0.52 mb/n mi | Crawford → 5.10 mb/n mi
* 897 mb center (New Hope 897.5 mb): New Hope → 0.52 mb/n mi | Crawford → 6.77 mb/n mi
Only the 912 mb center keeps Crawford’s slope inside the inner-edge range (≤ 4 mb/n mi) that matches the improving conditions. At 909 mb, the gradient rises to 4.55 mb/n mi, into the eyewall-core range. This confirms 912 mb as the lowest central pressure that satisfies the surface observations inside the radar-supported corridor.
1720Z — Sandals in Calm
Crawford had just gotten into the inner edge of the eye (pressure minimum, winds starting to ease). Sandals South Coast and New Hope were already inside the true calm eye floor. New Hope pressure ranges keep the gradient ≤1.5 mb/n mi under an 911 mb center.
Reanalyzed Intensity: 150 kt/911 mb
Refined track — 18.092°N, 77.986°W
* Sandals: 0.97 n mi
* New Hope: 0.89 n mi | 911.5–912.3 mb → 0.6–1.5 mb/n mi
* Crawford: 5.19 n mi | 926.0 mb → 2.89 mb/n mi
Sandals (Northernmost) — 18.097°N, 77.994°W
* Sandals: 0.73 n mi
* New Hope: 1.40 n mi | 911.5–913.1 mb → 0.4–1.5 mb/n mi
* Crawford: 5.73 n mi | 926.0 mb → 2.62 mb/n mi
Original radar-derived — 18.074°N, 77.984°W
* Sandals: 1.48 n mi
* New Hope: ~1.3 n mi | 911.5–913.0 mb → 0.4–1.5 mb/n mi
* Crawford: 4.6 n mi | 926.0 mb → 3.26 mb/n mi
Crawford’s gradients (2.6–3.3 mb/n mi) are consistent with the inner edge of the eye. Josh never reached the true calm core. All positions keep the New Hope gradient inside the calm-eye limit under 911 mb. This was Crawford’s pressure minimum and lowest gradient — the moment he entered the inner edge and the winds began to ease. Five minutes later, the pressure had already risen 7.5 mb (to 933.5 mb) and the gradient had increased to 3.99 mb/n mi, even as the center drew slightly closer and conditions continued to improve. That jump is the clear surface signature of continuous pre-landfall filling.
Sensitivity (refined-track distances)
* 911 mb center (New Hope 911.5 mb): New Hope → 0.56 mb/n mi | Crawford → 2.89 mb/n mi
* 908 mb center (New Hope 908.5 mb): New Hope → 0.56 mb/n mi | Crawford → 3.47 mb/n mi
* 905 mb center (New Hope 905.5 mb): New Hope → 0.56 mb/n mi | Crawford → 4.05 mb/n mi
* 898 mb center (New Hope 898.5 mb): New Hope → 0.56 mb/n mi | Crawford → 5.39 mb/n mi
Only the 911 mb center keeps Crawford’s slope inside the inner-edge range (≤ 4 mb/n mi) that matches the improving conditions. At 908 mb, the gradient rises to 3.47 mb/n mi (still marginal), while 905 mb and below push it above 4 mb/n mi into the eyewall-core range. This confirms 911 mb as the lowest central pressure that satisfies the surface observations inside the radar-supported corridor.
1700Z — Eye Reaches New Hope/Sandals
A little less than a half hour before landfall, the last direct New Hope measurement (913.5 mb) was recorded inside the eye, but not yet in the true calm. A gradient up to ~2 mb/n mi remains realistic for that inner-edge location. Central pressure 908 mb.
Reanalyzed Intensity: 150 kt/908 mb
Refined track — 18.047°N, 78.006°W
* Sandals: 3.81 n mi
* New Hope: 3.33 n mi | 913.5 mb → 1.65 mb/n mi
* Crawford: 5.43 n mi | 930.0 mb → 4.05 mb/n mi
Sandals (northernmost) — 18.052°N, 78.014°W
* Sandals: 3.44 n mi
* New Hope: 3.44 n mi | 913.5 mb → 1.60 mb/n mi
* Crawford: 5.91 n mi | 930.0 mb → 3.72 mb/n mi
Original radar-derived — 18.028°N, 78.002°W
* Sandals: 4.55 n mi
* New Hope: ~4.2 n mi | 913.5 mb → 1.31 mb/n mi
* Crawford: 5.4 n mi | 930.0 mb → 4.07 mb/n mi
Sensitivity (refined-track distances)
* 908 mb center: New Hope → 1.65 mb/n mi | Crawford → 4.05 mb/n mi
* 905 mb center: New Hope → 2.55 mb/n mi | Crawford → 4.60 mb/n mi
* 902 mb center (New Hope 913.5 mb): New Hope → 3.45 mb/n mi | Crawford → 5.16 mb/n mi
* 895 mb center: New Hope → 5.41 mb/n mi | Crawford → 6.45 mb/n mi
Inside the eye, but still outside the calm core, gradients of 1.6–2.0 mb/n mi at New Hope are realistic. Only a central pressure near 908 mb keeps that gradient in acceptable range. Lower values force New Hope into slopes that are simply too steep for the documented eye location.
The combination of distance, gradient, and conditions is decisive. At 3.3–3.4 n mi inside the eye, New Hope’s 1.6 mb/n mi slope under 908 mb matches a location that had entered the eye, but not yet the calm core. At the same time, Crawford, still in the eyewall at ~5.4 n mi, recorded “near total whiteout” rather than the earlier “100% whiteout”— a subtle easing that is consistent with a core already filling. An 895–897 mb center would have produced 5+ mb/n mi at New Hope and 6+ mb/n mi at Crawford, and even a 902 mb center already forces New Hope above 3 mb/n mi, which is wholly incompatible with both the eye entry at New Hope and the first noticeable signs of easing at Crawford. The official peak-intensity narrative cannot be reconciled with these simultaneous observations.
1741Z — Crawford Continues to Improve
The 915 mb central pressure and the further relaxation of Crawford’s gradient continue the filling that began well before landfall and accelerated further once the center moved inland. As the eye filled, the low-level radius of maximum winds broadened. The light rain, sub-hurricane force winds, and improved visibility at Crawford are the surface expression of that ongoing process. Sandals South Coast remained in calm conditions through ~1745Z.
Reanalyzed Intensity: 143 kt/915 mb
Refined track — 18.132°N, 77.968°W
* Sandals: 1.87 n mi
* New Hope: 2.46 n mi
* Crawford: 6.26 n mi | 935.6 mb → 3.29 mb/n mi
Sandals (northernmost) — 18.137°N, 77.977°W
* Sandals: 1.87 n mi
* New Hope: 2.75 n mi
* Crawford: 6.74 n mi | 935.6 mb → 3.06 mb/n mi
Original radar-derived — 18.115°N, 77.966°W
* Sandals: 1.38 n mi
* New Hope: 1.44 n mi
* Crawford: 5.5 n mi | 935.6 mb → 3.75 mb/n mi
Sensitivity (refined-track distance)
* 915 mb center: Crawford → 3.29 mb/n mi
* 912 mb center: Crawford → 3.77 mb/n mi
* 910 mb center: Crawford → 4.09 mb/n mi
Only the 915 mb center keeps Crawford’s slope (3.29 mb/n mi) consistent with the light rain and “winds well below hurricane force.” At 912 mb, the gradient rises to 3.77 mb/n mi — already too steep for the degree of improvement documented — and 906 mb and below move it into the eyewall-core range. This confirms pressures near 915 mb as those that satisfy the actual surface observations at 1741Z.
1800Z — Lewisville in the eye
Thirty-five minutes after landfall. Sandals and New Hope had both moved outside the calm eye, consistent with the end of the lull reported at Sandals South Coast near 1745Z.
Reanalyzed Intensity: 140 kt/918 mb
Refined track — 18.174°N, 77.950°W
* Sandals: 4.52 n mi
* New Hope: 5.07 n mi
* Lewisville High: 3.06 n mi | 925.5 mb → 2.45 mb/n mi
* Crawford: 8.12 n mi | 944.0 mb → 3.20 mb/n mi
Sandals (northernmost) — 18.171°N, 77.962°W
* Sandals: 4.08 n mi
* New Hope: 4.80 n mi
* Lewisville High: 3.57 n mi | 925.5 mb → 2.10 mb/n mi
* Crawford: 8.17 n mi | 944.0 mb → 3.18 mb/n mi
Original radar-derived — 18.149°N, 77.951°W
* Sandals: 3.28 n mi
* New Hope: 3.63 n mi
* Lewisville High: 2.67 n mi | 925.5 mb → 2.81 mb/n mi
* Crawford: 6.73 n mi | 944.0 mb → 3.86 mb/n mi
918 mb preserves a normal parabolic profile (gradient increases outward from the center) on all three tracks. The official 910 mb center under the refined position actually inverts the profile and remains too steep considering the eye-edge relative lull still affecting Crawford through ~1805Z. The continued rise from 915 mb at 1741Z to 918 mb is consistent with ongoing frictional filling.
Even the official sequence’s abrupt 13 mb pressure rise in the 35 minutes after landfall (a rate of approximately 22 mb/hr) is *still* not enough to close the gap created by the exceedingly low 897 mb landfall value. Under that trajectory, the 1800Z central pressure would still leave gradients at Lewisville and Crawford that are just simply too steep for the observed conditions and that also invert the normal parabolic profile. The surface data require the aforementioned higher landfall pressure; the rapid post-landfall rise assumed in the official record can’t retroactively produce gradients consistent with the observations.
Sensitivity (refined-track distances)
* 918 mb: Lewisville 2.45 mb/n mi | Crawford 3.20 mb/n mi
* 915 mb: Lewisville 3.43 mb/n mi | Crawford 3.57 mb/n mi
* 910 mb: Lewisville 5.07 mb/n mi | Crawford 4.19 mb/n mi
Only pressures near 918 mb keep both gradients consistent with the post-landfall conditions and a normal parabolic structure. Lower values steepen the slopes and invert the profile unrealistically.
1825Z — Crawford Back in the Eyewall
As the center continued to move farther inland, the southern portion of the eyewall moved over Crawford — bringing a return to extreme conditions.
Reanalyzed Intensity: 133 kt/923 mb
Refined track — 18.210°N, 77.921°W
* Sandals: 7.19 n mi
* New Hope: 7.65 n mi
* Lewisville High: 3.88 n mi
* Crawford: 10.00 n mi | 960.5 mb → 3.75 mb/n mi
Sandals (northernmost) — 18.207°N, 77.933°W
* Sandals: 7.12 n mi
* New Hope: 7.50 n mi
* Lewisville High: 3.92 n mi
* Crawford: 9.88 n mi | 960.5 mb → 3.80 mb/n mi
Original radar-derived — 18.185°N, 77.922°W
* Sandals: 6.51 n mi
* New Hope: 7.02 n mi
* Lewisville High: 3.48 n mi
* Crawford: 8.50 n mi | 960.5 mb → 4.41 mb/n mi
A central pressure of 923 mb produces gradients of 3.75–3.80 mb/n mi on the preferred tracks. Unlike an hour earlier at landfall, these values remain compatible with eyewall conditions once the RMW has broadened in a filling system. Crawford’s return to powerful winds at ~10 n mi with a 3.75 mb/n mi gradient is consistent with the broadened RMW of a filling system that has already lost its tight marine core. The 7 mb rise to 930 mb by 1900Z continues the more accelerated frictional filling following landfall of the center.
Sensitivity (refined-track distance)
* 923 mb center: Crawford → 3.75 mb/n mi
* 920 mb center: Crawford → 4.05 mb/n mi
* 918 mb center: Crawford → 4.25 mb/n mi
Pressures near 923 mb keep the gradient compatible with the observed powerful winds at the expanded RMW, while maintaining continuity with the 1900Z value.
1900Z — Lewisville Still in the Eyewall
By this time Sandals, New Hope, and Crawford were all outside the eyewall, while Lewisville continued to get battered by it.
Reanalyzed Intensity: 125 kt/930 mb
Refined track — 18.30°N, 77.85°W
* Lewisville High: 9.66 n mi
* Sandals: 13.99 n mi
* New Hope: 14.28 n mi
* Crawford: 15.76 n mi
Sandals (northernmost) — 18.297°N, 77.861°W
* Lewisville High: 9.42 n mi
* Sandals: 13.49 n mi
* New Hope: 13.83 n mi
* Crawford: 15.47 n mi
Original radar-derived — 18.275°N, 77.851°W
* Lewisville High: 9.13 n mi
* Sandals: 12.78 n mi
* New Hope: 12.98 n mi
* Crawford: 14.32 n mi
Lewisville at 9.7 n mi was still inside the broadened eyewall of a continued filling system, while Sandals, New Hope, and Crawford (14–16 n mi) were well outside of it. This matches the end of the calm near 1745Z at Sandals and Crawford’s 1833Z observation of a gradual decrease in conditions as the storm moved farther away. The 12 mb rise from 918 mb at 1800Z continues the frictional filling over interior terrain. No new surface pressure readings are available for this particular hour.
2000Z — Melissa approaching the northern coastline of Jamaica
Refined Center: 18.35°N, 77.80°W
Intensity: 115 kt/941 mb
* Kempshot: 5.0 n mi | 950.7 mb → 1.94 mb/n mi
* Hampden: 6.1 n mi | 958.0 mb → 2.78 mb/n mi
No tight inner-core structure remains. Gradients of roughly 2–3 mb/n mi at 5–6 n mi are typical of a rapidly filling vortex, whose RMW has broadened and whose boundary layer has been disrupted by prolonged terrain interaction.
The slight asymmetry (steeper forward, more relaxed trailing flank) is consistent with frictional compression (slowing and piling up of air against the terrain ahead of the center).
2100Z — Emerging Over Water as a weakened Category 3
Melissa moves back over water as a Category three hurricane, as it heads for eastern Cuba.
Track Center: 18.50°N, 77.55°W
Reanalyzed Intensity: 105 kt/953 mb
* Orange Valley: 8.4 n mi | 960.2 mb → 0.86 mb/n mi
* Sawyers: 7.9 n mi | 966.7 mb → 1.73 mb/n mi
The core has completed its island-induced filling cycle (61 mb rise from the 892 mb peak). Gradients have collapsed to under 2 mb/n mi across 8 n mi radii. This is the classic “unzipping” process of a small intense core over rugged terrain: where surface friction slows the boundary-layer wind, air piles up inside the former RMW, central pressure rises, the radius of maximum winds expands, and the once-sharp radial pressure slope relaxes and spreads outward.
The storm emerges off the northern coast as a broadened, heavily filled vortex rather than a tight marine system. Subsequent reconnaissance will sample and verify this disrupted structure over water. This 61 mb rise did not begin at landfall. It was already underway between the final reconnaissance fixes and continued progressively through final approach and the crossing of the island; the official characterization of a sudden post-landfall collapse does not match the observed sequence.
2200Z–0400Z — Verification of much weakened state
Roughly an hour after Melissa moved off the northern Jamaican shoreline, reconnaissance aircraft samples the system’s inner-core for the first time since prior to 1400Z (~ 3.70 hours before landfall).
* Reanalyzed baseline: 105 kt/952–953 mb
* 2200Z position: 18.60°N, 77.40°W
Reconnaissance
* NOAA2 fixes at 2210Z and 2253Z (12,000 ft): extrapolated surface pressures 952 mb and 953 mb; flight-level winds 88 kt and 95 kt at a broadened 15 n mi RMW.
* TDR: precipitation in the eye at 2210Z; no eye evident on radar by 2253Z.
* Later AFRES dropsondes (0242Z, 0437Z): 954 mb and 952 mb.
The evening reconnaissance shows a central pressure already in the low-to-mid 950s mb and an RMW that’s expanded to 15 n mi only about one hour after the center left Jamaica. That filled, broadened structure is the direct continuation of the filling already documented on final approach and across the island.
A landfall pressure near 912 mb, followed by continued filling to the 952–954 mb values measured only about one hour after the center left Jamaica (41 mb rise), is consistent with that progressive trend. Holding 897 mb at landfall would require a 56 mb rise over the same short interval — an extreme rate that did not occur solely during the ~3.5-hour passage over land.
TCR Reasons and Counters
The Jamaica intensity section of the Tropical Cyclone Report cites the lack of late reconnaissance and the degraded satellite presentation, then applies only a very slight reduction from the earlier peak to arrive at 160 kt/897 mb at landfall. Each reason is paired below with the actual late-cycle data:
Reason: Lack of late reconnaissance and only a slight reduction from peak.
Counter: The final center fixes (1302Z–1346Z) showed a measured pressure rise of 2 mb in 44 minutes (2.7 mb/hr) while the core was still very near its peak structure. The official sequence then carries only another 3 mb increase over the next 221 minutes (3.7 hours) to landfall (0.8 mb/hr) while the core interacted with elevated coastal terrain, before requiring an abrupt 13 mb rise in the 35 minutes immediately after landfall (22.3 mb/hr). That rate discontinuity is opposite to the expected topographic response of a compact core and is certainly not supported by the continuous pressure rise recorded at New Hope and Crawford before and across landfall. Even that abrupt post-landfall rise is still not enough to produce gradients at 1800Z consistent with the observed conditions; the surface data require the higher landfall pressure (no less than 910 mb).
Reason: New Hope 913.5 mb and Crawford 926.0–933.5 mb readings treated as compatible with 897 mb.
Counter: These in-situ data are treated as compatible with an 897 mb center by placing Crawford on the inner edge of the eye and invoking an unsupported steep gradient, in part by citing the 5.4 n mi extrapolated pressure from the final reconnaissance pass. That pass, however, placed the wind maximum near 8 n mi, so 5.4 n mi already lay inside the RMW. A gradient steep enough to bridge 897 mb to Crawford’s pressure over that distance is an eyewall-core value, not an inner-edge eye value. At the documented distances and conditions (Sandals and New Hope on the calm eye floor; Crawford just inside the inner edge with winds easing and a 7.5 mb pressure rise in the last five minutes before landfall), an 897 mb center requires eyewall-scale gradients (4–6+ mb/n mi) across locations the observations clearly place inside the eye. There was no measured 30 mb difference at landfall. That number appears only if the central pressure is assumed to be 897 mb. But, as the hourly blocks have clearly demonstrated, only a central pressure of 910–912 mb keeps both stations inside or at the edge of the eye with gradients that match the reported conditions.
Reason: Degraded satellite presentation acknowledged, but given very limited weight.
Counter: The unmistakable progressive cloud top warming and loss of organization on infrared satellite imagery continued unabated from 1400Z through landfall and is consistent with a filling core, not with a storm that supposedly remained at 897 mb until the coastline. The hourly sequence shows continuous substantial degradation that matches the measured pressure rise and the surface observations; it is not such a minor adjustment.
Conclusion
As seen, only a landfall pressure of 910–912 mb keeps both New Hope and Crawford inside or at the edge of the eye with gradients and conditions that actually match the surface reports, across the three center positions tested. The official 897 mb value requires eyewall-scale gradients across locations the observations place on the eye floor and completely ignores the filling already measured hours before landfall. The 1720Z snapshot already requires approximately 911 mb to align with the real-world gradients; the filling was continuous and well underway before the center reached the coast. The official figure is an extrapolation of the open-ocean peak, not a fit to the substantially weakened system that made landfall.
Simply put, the objective data leave 150 kt/910–912 mb as the best single intensity estimate the late-cycle observations will support. Unlike the official estimate, which retains near-peak intensity by applying only a very slight reduction to earlier reconnaissance without actually testing the Jamaica surface readings against the documented eye structure, this value is derived solely from a complete analysis of the objective late-cycle data.
The immediate post-landfall satellite analysis (1800Z–1915Z) and the full list of references and sources appear in the replies.


Hurricane Melissa’s Jamaica Landfall: The Official Estimate Versus the Data
The official landfall intensity remains 160 kt/897 mb, which constitutes an official tie for the strongest #hurricane on record in the entire Western Hemisphere. That figure, however, is simply not supported by the available evidence. In the following in-depth reanalysis, we reexamine the reconnaissance data, structural evolution, satellite trends, and surface observations to determine the absolute best single intensity estimate at the time of Melissa’s catastrophic strike on western Jamaica.
What the official (NHC) Tropical Cyclone Report requires to retain 160 kt/897 mb
To hold the official landfall intensity of 160 kt/897 mb, the TCR effectively has to:
* Carry the peak intensity profile and an exaggerated inner-eyewall pressure gradient from the final reconnaissance pass all the way to the time of landfall.
* Discount the significant satellite degradation — eye filling and progressive cloud-top warming — that became increasingly pronounced after 1500Z.
* Set aside a straightforward extrapolation of the 2 mb pressure rise already measured between the last two center fixes (892 mb adjusted at 1302Z to 894 mb adjusted at 1346Z) over just 44 minutes, which by itself reaches approximately 904 mb by 1725Z.
* Treat the New Hope (913.5 mb at 1700Z, 3.5–4 n mi from the center) and Crawford (926.0 mb at 1720Z, 4.6 n mi from the center) readings as if they were not actually taken inside the eye, despite the documented conditions at both locations.
Producing 897 mb from those surface readings requires radial pressure rises of 16.5 mb over only 3.5–4 n mi to New Hope and 29 mb over just 4.6 n mi to Crawford — gradients of 4–6+ mb per n mi inside the eye. That degree of steepness is strictly eyewall territory. Inside the eye, warm subsident air and very low tangential winds produce a near-flat pressure field. Dropsonde observations routinely show minimal inner-core gradients and approximate gradient-wind balance above the boundary layer (García-Franco et al., 2021). Recent dropsonde analyses show that inner-eye radial gradients are typically very small — on the order of 1–2 mb or less over several nautical miles.
A Reconstruction Based on Observed Data
The final reconnaissance pass (ending 1346Z) established a near-flat pressure field inside an 8 n mi RMW and a central pressure of 894 mb (adjusted). The pressure had already risen 2 mb in the preceding 44 minutes (from 892 mb adjusted at 1302Z).
The TCR’s description of a 35–40 mb drop from center to the RMW over 5–8 n mi on that pass mixes two different radii: the actual wind maximum was near 8 n mi (VDM max wind 172 kt at 1351Z, dropsondes, and outbound HDOB), while the 5 n mi end of the range comes from a single inbound HDOB at 1344:30Z (extrapolated SLP of 927.7 mb at 5.4 n mi, inside the wind maximum). The dropsondes on the same pass confirm the surface wall near 8 n mi (927 mb south, 932 mb northwest). The official range therefore exaggerates the inner-eyewall gradient by treating an extrapolated pressure radius as if it were the RMW.
A peaked eyewall gradient of the magnitude actually observed demands a relatively flat inner eye — not the 16.5–29 mb rises over 3.5–5 n mi required to reach 897 mb from the New Hope and Crawford readings. Even in the record-intense Hurricane Patricia (872 mb peak), high-density dropsonde data showed inner-eye differentials of < 2 mb across comparable distances, despite eyewall gradients reaching 24 mb per n mi. Melissa’s required inner-eye variation far exceeds that precedent. As the cyclone neared landfall moving at a slow translation speed of 7 knots, Jamaica’s elevated terrain supplied an additional physical mechanism for accelerated disruption of low-level inflow that is typical in a high-end, small-core hurricane (Rogers et al., 2017).
The only direct measurements of the core in the final hour perfectly track this topographically induced filling trend. At 1700Z, New Hope Primary School recorded a surface pressure of 913.5 mb at a radar-derived distance of 3.5–4 n mi from the center. Twenty minutes later at 1720Z, the Crawford (iCyclone) sensor — positioned 4.6 n mi from the center, just inside the inner edge of the eye — registered a pressure of 926.0 mb amidst documented light-to-moderate rain and winds well below hurricane force. These ground-truth readings are mutually consistent with a rapidly degrading system and are wholly incompatible with a central pressure remotely close to the official 897 mb under the near-flat inner-eye structure documented by reconnaissance.
Maintaining a standard, near-flat inner-eye pressure field relative to the New Hope data yields a most likely central pressure of 912 mb at landfall. This satisfies a realistic 1–2 mb gradient across the eye floor and places Crawford right at the naturally steepening inner boundary of the eyewall. While standard wind-pressure relationships (WPR) might suggest lower wind speeds for a 912 mb storm moving at a slow 7 knots, Melissa’s extreme core contraction — with an RMW of only 8 n mi — allowed it to maintain an exceptionally high pressure gradient parameter even as the storm filled, enabling it to sustain 150 knot Category 5 winds right up to the coast.
However, a central pressure as low as 910 mb can’t be entirely ruled out as an absolute floor of physical plausibility. As the southern and eastern eyewall scraped the rugged terrain, severe boundary-layer friction likely induced localized, asymmetric compression of the internal gradient on the peripheral edge of the eye where Crawford was situated. This land-induced asymmetry can account for a steeper localized gradient to bridge a 910 mb center to Crawford, without requiring a pristine, ultra-intense 897 mb core configuration. Therefore, while 910 mb represents the baseline's floor, a value of 912 mb/150 kt stands as the most consistent, elegant, and mathematically supported estimate for Melissa’s landfall.
Hourly Satellite Analysis (BD-Curve Infrared Imagery)
(See the close-up four-panel IR sequence attached to the quoted post for the progression through landfall.)
1200Z (Near Peak)
The eye is clear and small, with a very well-defined round circular shape. Immediately surrounding the clear center is a tight, symmetrical sequence of very narrow color strips (blue, yellow, light red/dark orange, and black). These mark the steep temperature gradient at the edge of the eye and the innermost portion of the eyewall. Beyond the black strip lies the broader Central Dense Overcast (CDO), which is dominated by white and a light gray shading with intermixed pink areas. The pink marks the coldest cloud tops contained within the CDO.
The overall structure is tight and continuous, with no noticeable intrusion of the warmer colors into the eyewall region or CDO. In short, this is the classic appearance of a high-end Category 5 at or near maximum intensity.
1300Z
The eye remains clear, small, and well-defined. The innermost color strips (blue, yellow, light red/dark orange, and black) are still tight and symmetrical. The primary change from 1200Z is modest warming within the surrounding CDO: the white shading immediately outside the black eyewall strip has expanded into more light gray. Pink areas are still present, but slightly less continuous in the innermost CDO. This is a subtle early indication of the beginning of structural decline, consistent with the 2 mb pressure rise measured between the final reconnaissance fixes.
The overall presentation, however, remains that of a high-end Category 5.
1400Z
The eye remains clear and well-defined. The innermost color strips are still present and remain relatively tight. Further warming is now visible in the CDO immediately outside the eyewall. Darker gray tones have developed closest to the black strip, and the light gray has expanded outward. This is the first noticeable encroachment of warmer colors toward the eyewall region.
These changes are consistent with the aforementioned weakening observed between the final reconnaissance fixes (1302–1346Z) and marks the beginning of more evident structural decline from the peak presentation.
1500Z
The eye remains well-shaped, but has continued to become less sharply defined than at peak. The innermost color strips have begun to lose definition: the red ring has expanded and overtaken portions of the black band, and warmer tones are appearing closer to the eye. In the surrounding CDO, warming has also continued. Darker gray tones have expanded around the eyewall region, with intermixed black splotches. The light gray has become even more extensive.
This represents a clear continuation of the structural decline that began after 1300Z, featuring the first evident degradation of the eyewall color strips themselves.
1600Z
The eye remains relatively well-shaped, but has lost further definition. The innermost color strips outside the blue and yellow have warmed substantially: black has overtaken much of the previous red, red has moved into the former black band, and black has replaced darker gray farther outward in the CDO. Warming of the surrounding CDO has continued, with darker gray and black tones more extensive around the eyewall region.
This interval coincided with the outer edge of the eyewall first reaching the western Jamaican coast around 1515Z. The topographically driven structural decline is now well established.
1700Z (Final Approach)
As the eye makes its final approach and the RMW in the northeastern eyewall moves onshore over southwestern Jamaica, the satellite presentation shows far more dramatic deterioration. The eye has lost significant definition and shape; it is smaller and more cloud-filled. Warming has continued throughout the CDO and is most pronounced in the eyewall region. Each of the color strips immediately around the eye has warmed, with the colors bleeding into one another. None retains a solid, well-defined strip. The red band that was once tight and continuous is now significantly distorted.
This marks a clear acceleration of the structural decline as the core heavily interacts with the coastline.
1725Z (Landfall)
During the final 25–30 minutes prior to landfall, the weakening further accelerated. The eye has contracted further and is increasingly cloud-filled. Its once well-defined and symmetrically circular shape is now noticeably distorted. The same pattern of progressive warming has continued: the innermost color strips have lost additional definition, and warmer tones have expanded further into the eyewall and innermost CDO.
The presentation at landfall is substantially degraded from the peak structure at 1200Z and is completely consistent with the continued core filling indicated by both the New Hope and Crawford eye surface readings.
Hourly intensity estimates
Based on the reconnaissance pressures, the measured filling rate, the progressive satellite degradation, and the eye surface readings:
* 1200Z: 165 kt/891 mb
* 1300Z: 165 kt/892 mb
* 1400Z: 165 kt/895 mb
* 1500Z: 160 kt/898 mb
* 1600Z: 155 kt/902 mb
* 1700Z: 150 kt/907 mb
* 1725Z (landfall): 150 kt/912 mb (plausible localized range down to 910 mb)
As seen, there is simply no possible basis for the official landfall intensity of 160 kt/897 mb. Every independent piece of evidence available after the final reconnaissance passes indicates progressive, significant weakening. The data that exist leave no other conclusion: #Melissa underwent pronounced inner-core weakening and made landfall well below its historic peak.


Nevada Morgan retweeted

Police have charged two men in relation to the crash that claimed the lives of four teenagers in Ocho Rios, St Ann last Saturday.
Akeem Palmer and Omarko Green have been charged with leaving the scene of an accident and failing to report an accident.
jamaicaobserver.com/2026/11/…

Nevada Morgan retweeted

🚨 THIS COULD HAVE SERIOUS CONSEQUENCES FOR JESÚS OWONO.
According to the report, under Spanish law, if Owono were convicted of a serious offence involving negligence in the course of his sporting duties, he could face 1–4 years in prison, alongside a possible 3–6 year professional disqualification.
The National Police have opened an investigation following the death, which is a standard procedure in cases involving an unnatural death.
However, there is currently no formal accusation or conviction against Owono.
This is a very serious situation, and the investigation needs to establish exactly what happened.
What do you think? Should incidents like this carry criminal consequences for players, or should they be handled strictly within football? 👀
#JesusOwono #Tenerife #Spain
---Championsleagueig

Nevada Morgan retweeted

New Euro seasonal model run for December 2026 through February 2027... keep in mind this is a blend of many members.
Rain anomaly of +10" above normal from Tampa to Fort Myers.
Verbatim that would be #2 wettest winter in the Fort Myers and Tampa areas if correct.
This forecast if correct also would make Orlando top-4 wettest winter on record.

Nevada Morgan retweeted

November 2-3, 2020:
Hurricane Eta rapidly intensified into a high-end Category 4 as it neared Nicaragua.
Eta remains the third-strongest November Atlantic hurricane on record. It was also the 28th system of tropical storm or higher intensity in the 2020 season.
#wxhistory

Nevada Morgan retweeted

Here is Jesús Owono’s reaction after his tackle on Jesús de Miguel:
- He was heading straight down the tunnel because he knew it was a red-card offence, which he was shown on the spot.
- His teammate even went over to greet him for the tackle, not realizing how serious the situation was.
- He rushed back immediately when he realized the severity of the situation.
It was a reckless tackle, and the consequences are heartbreaking. But we must remember that none of these players goes onto the pitch intending to take the life of a fellow player.
Nevada Morgan retweeted

He estado mirando la jugada de Jesús de Miguel fotograma a fotograma
Owono sale a despejar en el descuento y el golpe le llega en pleno pecho
Se queda en el suelo, le atienden más de diez minutos y camino de la ambulancia sufre la parada
No hay causa oficial, pero técnicos de emergencias hablan de commotio cordis: un golpe que cae justo en una ventana de veinte milisegundos del latido y para el corazón
Treinta años
Descansa en paz, Jesús 🙏
Todo mi cariño a su familia y a todo el Tenerife
Nevada Morgan retweeted

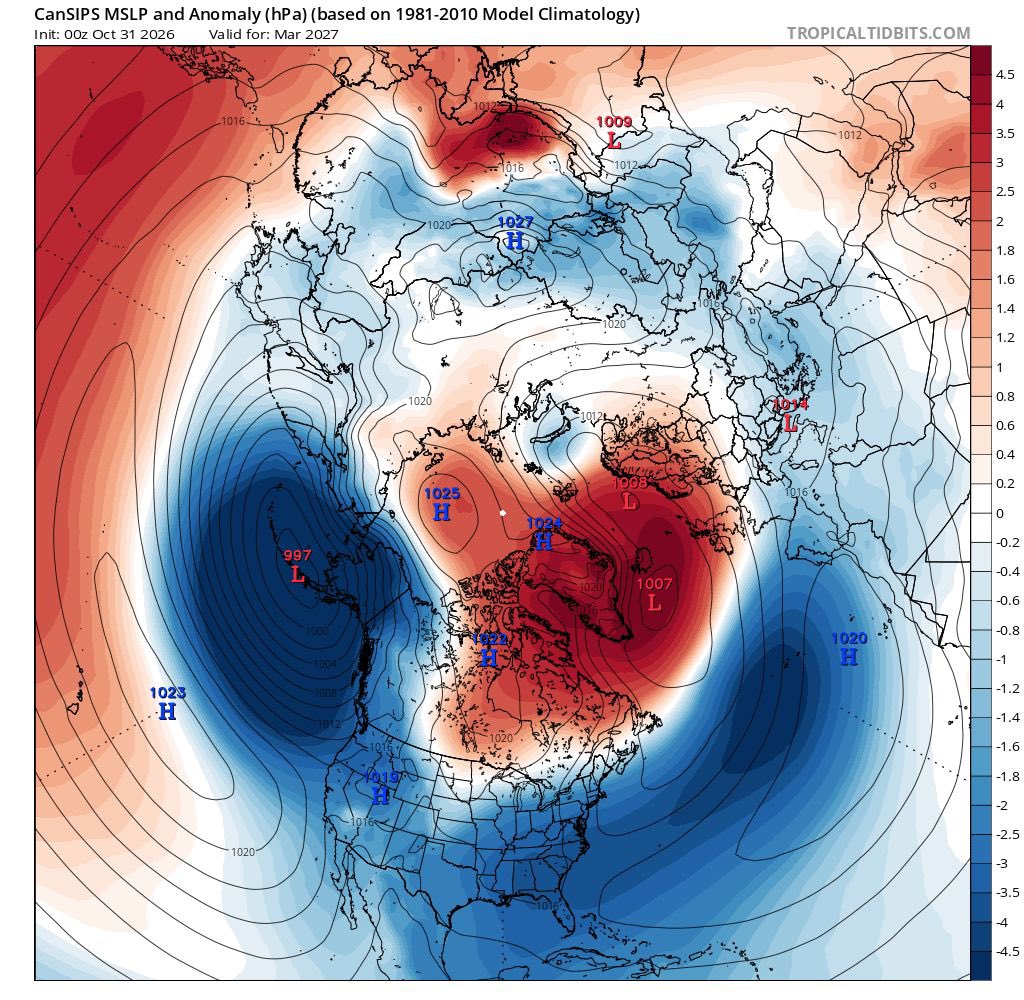
The latest CANSIPS seasonal forecast has a very, very blocked forecast for December, January, February & March, I.e this model is forecasting a prolonged and cold winter.
I don’t think I’ve ever seen a seasonal forecast like this before.


Nevada Morgan retweeted

Man breaks into woman’s house 4 am in the morning in Trinidad 🇹🇹 but it didn’t go the way he thought it would
Nevada Morgan retweeted

Beatrice Masilingi 🇳🇦 has switched her running spikes for the rugby field.
The triple silver medallist from the World U20 Championships in 2021 confirmed the move last week, following World Athletics regulations regarding DSD (Disorders of sex development) athletes.
Speaking to local media, she said, “I wanted to be part of a sport code again after leaving track because of the World Athletics regulations. I decided to come back and play rugby because I already have a bit of knowledge of the game.” 🎤
📸 Simon Maina


Nevada Morgan retweeted

The carnage on Jamaica’s roadways continues, with another motorcyclist reportedly killed in a crash this morning along Orchard Main Road in Hopewell, Hanover. The police are probing #Sunday #November #Crash #Jamaica #RoadSafety
Nevada Morgan retweeted

#StarNews: When 30-year-old Jeanell Chambers was told that her newborn son had been born without an anus, she struggled to comprehend what the doctors were telling her.
READ MORE: jamaica-star.com/article/new…

Nevada Morgan retweeted
Hurricane Melissa’s Jamaica Landfall: The Official Estimate Versus the Data
The official landfall intensity remains 160 kt/897 mb, which constitutes an official tie for the strongest #hurricane on record in the entire Western Hemisphere. That figure, however, is simply not supported by the available evidence. In the following in-depth reanalysis, we reexamine the reconnaissance data, structural evolution, satellite trends, and surface observations to determine the absolute best single intensity estimate at the time of Melissa’s catastrophic strike on western Jamaica.
What the official (NHC) Tropical Cyclone Report requires to retain 160 kt/897 mb
To hold the official landfall intensity of 160 kt/897 mb, the TCR effectively has to:
* Carry the peak intensity profile and an exaggerated inner-eyewall pressure gradient from the final reconnaissance pass all the way to the time of landfall.
* Discount the significant satellite degradation — eye filling and progressive cloud-top warming — that became increasingly pronounced after 1500Z.
* Set aside a straightforward extrapolation of the 2 mb pressure rise already measured between the last two center fixes (892 mb adjusted at 1302Z to 894 mb adjusted at 1346Z) over just 44 minutes, which by itself reaches approximately 904 mb by 1725Z.
* Treat the New Hope (913.5 mb at 1700Z, 3.5–4 n mi from the center) and Crawford (926.0 mb at 1720Z, 4.6 n mi from the center) readings as if they were not actually taken inside the eye, despite the documented conditions at both locations.
Producing 897 mb from those surface readings requires radial pressure rises of 16.5 mb over only 3.5–4 n mi to New Hope and 29 mb over just 4.6 n mi to Crawford — gradients of 4–6+ mb per n mi inside the eye. That degree of steepness is strictly eyewall territory. Inside the eye, warm subsident air and very low tangential winds produce a near-flat pressure field. Dropsonde observations routinely show minimal inner-core gradients and approximate gradient-wind balance above the boundary layer (García-Franco et al., 2021). Recent dropsonde analyses show that inner-eye radial gradients are typically very small — on the order of 1–2 mb or less over several nautical miles.
A Reconstruction Based on Observed Data
The final reconnaissance pass (ending 1346Z) established a near-flat pressure field inside an 8 n mi RMW and a central pressure of 894 mb (adjusted). The pressure had already risen 2 mb in the preceding 44 minutes (from 892 mb adjusted at 1302Z).
The TCR’s description of a 35–40 mb drop from center to the RMW over 5–8 n mi on that pass mixes two different radii: the actual wind maximum was near 8 n mi (VDM max wind 172 kt at 1351Z, dropsondes, and outbound HDOB), while the 5 n mi end of the range comes from a single inbound HDOB at 1344:30Z (extrapolated SLP of 927.7 mb at 5.4 n mi, inside the wind maximum). The dropsondes on the same pass confirm the surface wall near 8 n mi (927 mb south, 932 mb northwest). The official range therefore exaggerates the inner-eyewall gradient by treating an extrapolated pressure radius as if it were the RMW.
A peaked eyewall gradient of the magnitude actually observed demands a relatively flat inner eye — not the 16.5–29 mb rises over 3.5–5 n mi required to reach 897 mb from the New Hope and Crawford readings. Even in the record-intense Hurricane Patricia (872 mb peak), high-density dropsonde data showed inner-eye differentials of < 2 mb across comparable distances, despite eyewall gradients reaching 24 mb per n mi. Melissa’s required inner-eye variation far exceeds that precedent. As the cyclone neared landfall moving at a slow translation speed of 7 knots, Jamaica’s elevated terrain supplied an additional physical mechanism for accelerated disruption of low-level inflow that is typical in a high-end, small-core hurricane (Rogers et al., 2017).
The only direct measurements of the core in the final hour perfectly track this topographically induced filling trend. At 1700Z, New Hope Primary School recorded a surface pressure of 913.5 mb at a radar-derived distance of 3.5–4 n mi from the center. Twenty minutes later at 1720Z, the Crawford (iCyclone) sensor — positioned 4.6 n mi from the center, just inside the inner edge of the eye — registered a pressure of 926.0 mb amidst documented light-to-moderate rain and winds well below hurricane force. These ground-truth readings are mutually consistent with a rapidly degrading system and are wholly incompatible with a central pressure remotely close to the official 897 mb under the near-flat inner-eye structure documented by reconnaissance.
Maintaining a standard, near-flat inner-eye pressure field relative to the New Hope data yields a most likely central pressure of 912 mb at landfall. This satisfies a realistic 1–2 mb gradient across the eye floor and places Crawford right at the naturally steepening inner boundary of the eyewall. While standard wind-pressure relationships (WPR) might suggest lower wind speeds for a 912 mb storm moving at a slow 7 knots, Melissa’s extreme core contraction — with an RMW of only 8 n mi — allowed it to maintain an exceptionally high pressure gradient parameter even as the storm filled, enabling it to sustain 150 knot Category 5 winds right up to the coast.
However, a central pressure as low as 910 mb can’t be entirely ruled out as an absolute floor of physical plausibility. As the southern and eastern eyewall scraped the rugged terrain, severe boundary-layer friction likely induced localized, asymmetric compression of the internal gradient on the peripheral edge of the eye where Crawford was situated. This land-induced asymmetry can account for a steeper localized gradient to bridge a 910 mb center to Crawford, without requiring a pristine, ultra-intense 897 mb core configuration. Therefore, while 910 mb represents the baseline's floor, a value of 912 mb/150 kt stands as the most consistent, elegant, and mathematically supported estimate for Melissa’s landfall.
Hourly Satellite Analysis (BD-Curve Infrared Imagery)
(See the close-up four-panel IR sequence attached to the quoted post for the progression through landfall.)
1200Z (Near Peak)
The eye is clear and small, with a very well-defined round circular shape. Immediately surrounding the clear center is a tight, symmetrical sequence of very narrow color strips (blue, yellow, light red/dark orange, and black). These mark the steep temperature gradient at the edge of the eye and the innermost portion of the eyewall. Beyond the black strip lies the broader Central Dense Overcast (CDO), which is dominated by white and a light gray shading with intermixed pink areas. The pink marks the coldest cloud tops contained within the CDO.
The overall structure is tight and continuous, with no noticeable intrusion of the warmer colors into the eyewall region or CDO. In short, this is the classic appearance of a high-end Category 5 at or near maximum intensity.
1300Z
The eye remains clear, small, and well-defined. The innermost color strips (blue, yellow, light red/dark orange, and black) are still tight and symmetrical. The primary change from 1200Z is modest warming within the surrounding CDO: the white shading immediately outside the black eyewall strip has expanded into more light gray. Pink areas are still present, but slightly less continuous in the innermost CDO. This is a subtle early indication of the beginning of structural decline, consistent with the 2 mb pressure rise measured between the final reconnaissance fixes.
The overall presentation, however, remains that of a high-end Category 5.
1400Z
The eye remains clear and well-defined. The innermost color strips are still present and remain relatively tight. Further warming is now visible in the CDO immediately outside the eyewall. Darker gray tones have developed closest to the black strip, and the light gray has expanded outward. This is the first noticeable encroachment of warmer colors toward the eyewall region.
These changes are consistent with the aforementioned weakening observed between the final reconnaissance fixes (1302–1346Z) and marks the beginning of more evident structural decline from the peak presentation.
1500Z
The eye remains well-shaped, but has continued to become less sharply defined than at peak. The innermost color strips have begun to lose definition: the red ring has expanded and overtaken portions of the black band, and warmer tones are appearing closer to the eye. In the surrounding CDO, warming has also continued. Darker gray tones have expanded around the eyewall region, with intermixed black splotches. The light gray has become even more extensive.
This represents a clear continuation of the structural decline that began after 1300Z, featuring the first evident degradation of the eyewall color strips themselves.
1600Z
The eye remains relatively well-shaped, but has lost further definition. The innermost color strips outside the blue and yellow have warmed substantially: black has overtaken much of the previous red, red has moved into the former black band, and black has replaced darker gray farther outward in the CDO. Warming of the surrounding CDO has continued, with darker gray and black tones more extensive around the eyewall region.
This interval coincided with the outer edge of the eyewall first reaching the western Jamaican coast around 1515Z. The topographically driven structural decline is now well established.
1700Z (Final Approach)
As the eye makes its final approach and the RMW in the northeastern eyewall moves onshore over southwestern Jamaica, the satellite presentation shows far more dramatic deterioration. The eye has lost significant definition and shape; it is smaller and more cloud-filled. Warming has continued throughout the CDO and is most pronounced in the eyewall region. Each of the color strips immediately around the eye has warmed, with the colors bleeding into one another. None retains a solid, well-defined strip. The red band that was once tight and continuous is now significantly distorted.
This marks a clear acceleration of the structural decline as the core heavily interacts with the coastline.
1725Z (Landfall)
During the final 25–30 minutes prior to landfall, the weakening further accelerated. The eye has contracted further and is increasingly cloud-filled. Its once well-defined and symmetrically circular shape is now noticeably distorted. The same pattern of progressive warming has continued: the innermost color strips have lost additional definition, and warmer tones have expanded further into the eyewall and innermost CDO.
The presentation at landfall is substantially degraded from the peak structure at 1200Z and is completely consistent with the continued core filling indicated by both the New Hope and Crawford eye surface readings.
Hourly intensity estimates
Based on the reconnaissance pressures, the measured filling rate, the progressive satellite degradation, and the eye surface readings:
* 1200Z: 165 kt/891 mb
* 1300Z: 165 kt/892 mb
* 1400Z: 165 kt/895 mb
* 1500Z: 160 kt/898 mb
* 1600Z: 155 kt/902 mb
* 1700Z: 150 kt/907 mb
* 1725Z (landfall): 150 kt/912 mb (plausible localized range down to 910 mb)
As seen, there is simply no possible basis for the official landfall intensity of 160 kt/897 mb. Every independent piece of evidence available after the final reconnaissance passes indicates progressive, significant weakening. The data that exist leave no other conclusion: #Melissa underwent pronounced inner-core weakening and made landfall well below its historic peak.
On the one-year anniversary, social media will be flooded with claims that Hurricane #Melissa is justifiably tied for the strongest Western Hemisphere landfall on record (per the official estimates).
Although it is natural to have an inherent interest in hopes of retaining a record-level event, it is most important that one set aside any inherent biases to analyze the objective data completely devoid of emotion and rigorously follow where the evidence leads.
Consequently, a very detailed reanalysis of the landfall intensity is forthcoming. It examines the reconnaissance structure, the measured pressure trend, the eye surface readings, and the progressive satellite degradation after the final aircraft passes.
As you will see, the official 160 kt/897 mb estimate is not even remotely supported by those data. The full breakdown, including the *best* single intensity estimate, will be posted within the next couple of days.


Nevada Morgan retweeted
#StarNews: The family of Petrina Simone Clayton, the mother of six whose fight against stage-four cancer and renal failure touched many Jamaicans, is mourning her death after she passed away on Wednesday night.
READ MORE: jamaica-star.com/article/new…

Nevada Morgan retweeted

View from my hotel in Crawford #Jamaica BEFORE & AFTER Cat 5 #Hurricane #MELISSA. This spot was in the storm's right-front quad (the strongest part) & most certainly saw winds gusting well over 200 mph. These fierce winds scrubbed landscape bare, flattened or unroofed every house, & even destroyed concrete buildings—like the one across the street. Just the sound of these winds was harsh—an ear-splitting scream.
