

NOAA provides science, service and stewardship to protect life, property & Earth's natural resources. An agency of @CommerceGov. Join us on Instagram & Facebook
- Tweets21.3K
- Following163
- Followers1.4M
- Likes327




ALT A car drives through a snowstorm in Broomfield, Colorado, in 2024. Credit: Bob Hyatt/NOAA

ALT The 2026-2027 U.S. Winter Outlook map for temperature shows the greatest chances for warmer-than-average conditions in the Pacific Northwest, northern Rockies, Midwest, Mississippi Valley, much of the East and Alaska. (Image credit: NOAA)


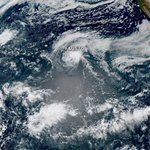
ALT This data visualization shows the area and shape of the ozone hole on September 18, 2026, the day of its annual maximum extent. Scientists define the ozone hole as the area in which ozone concentrations drop below the historical threshold of 220 Dobson units. Credit NASA Earth Observatory

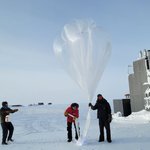
ALT NOAA Corps LT Michael Doneghey, the South Pole observatory station lead, holds a weather balloon while NOAA Station Technician Luke Longren carries a package containing an ozonesonde — an airborne instrument that measures ozone levels — just prior to launch on October 18, 2026. (Image credit: Tommy Jensen/Amentum. With permission.)

ALT NOAA Weather Prediction Center map showing excessive rainfall and flash flooding risks across the south-central United States. A slight risk (yellow) extends from eastern Arkansas through western Tennessee into northern Mississippi, including Memphis. A broader marginal risk (green) stretches from southeastern Texas and Louisiana northward through Arkansas, Missouri, western Tennessee, and Mississippi. A separate marginal risk area covers southeastern Florida, including Miami, with a small slight risk area near Miami. No moderate or high risk areas are indicated.


ALT A NOAA 6–10 Day Precipitation Outlook map valid for November 3–7, 2026, showing precipitation probability anomalies across the United States. Most of the central, southern, and eastern portions of the country, as well as southern Alaska, are favored for above-normal precipitation, with the greatest likelihood centered over the Southern Plains and Mississippi Valley. Below-normal precipitation is favored across the northern Rockies and northern Plains, with near-normal conditions expected across the Pacific Northwest and northern Alaska.

ALT A NOAA 6–10 Day Temperature Outlook map valid for November 3–7, 2026, illustrating forecast temperature probability anomalies across the United States. Above-normal temperatures are heavily favored across almost all of the United States. A region of near-normal temperatures is predicted across parts of the Desert Southwest and southern Rockies.

ALT A U.S. Drought Monitor map displays dryness levels and drought impacts across the nation for October 27, 2026. Severe to exceptional drought dominates large portions of the lower Mississippi Valley, the interior West, and the Upper Midwest, with widespread dry conditions reaching into the southern Plains and Southeast. In contrast, extensive areas of the Plains, central Midwest, and the Mid-Atlantic remain largely free of significant drought.


ALT Graph showing elevated water levels entering the minor flooding stage at the La Jolla, CA station

ALT U.S. surface weather map valid 8am EDT Oct 28, 2026 showing fronts, H/L pressure centers, green hatched areas for rain/thunderstorms, purple for mixed/heavy snow in the Northwest, and Tropical Storm Vance off Mexico.

ALT Moisture will be returning to the U.S. this week. Locally heavy rainfall will enter western Texas Thursday into Friday from the remnants of T.S. Vance. A storm system will enter the southern West Coast Friday and Saturday, brining widespread showers and thunderstorms.

ALT Image from CORA capturing historical maximum water levels for California’s San Francisco Bay area in yellow and red on a dark gray map


ALT NOAA Weather Prediction Center map showing a Marginal Risk (at least 5%) of excessive rainfall and flash flooding across portions of southern New Mexico and western Texas, including the Big Bend region. An embedded Slight Risk area (at least 15%) covers portions of southeastern New Mexico and far western Texas.

ALT NOAA Weather Prediction Center map showing Marginal Risk (at least 5%) areas of excessive rainfall and flash flooding across portions of Arizona, New Mexico, and western and central Texas. An embedded Slight Risk area (at least 15%) covers portions of southwestern Arizona, including areas near the California and Mexico borders.

ALT National Weather Service map showing forecast daytime high temperatures across the continental U.S. for Oct 31, 2026, with color fill for departures from climatology — warmest (70s–80s°F) in the central and eastern states, cooler (40s–60s°F) along the West Coast and Pacific Northwest.
