

ORA's mission is to support the budget and policymaking process with forecasts, estimates, and analyses that ensure the District's financial integrity.
- Tweets237
- Following73
- Followers462
- Likes2
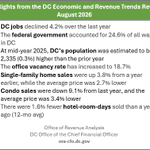





ALT Image reports the highlights from the DC Economic and Revenue Trends report published by the District of Columbia Office of Revenue Analysis for August 2026. The image highlights that DC jobs declined 4.2% over the last year; federal government accounted for 24.6% of all wages in DC; at mid-year 2025, DC’s population was estimated to be 2,335 or 0.3% higher than the prior year; the office vacancy rate has increased to 18.7%; single-family home sales were up 3.8% from a year earlier, while the average home price was 2.7% lower; condo sales were down 9.1% from last year and the average price was 3.4% lower; and, there were 1.6% fewer hotel-room-days sold than a year ago. The report highlights changes in employment, wages, office vacancy rate, single-family home sales, condo sales, and hotel-room-days. Users can read more by clicking the link in the post.

ALT Image reports the highlights from the DC Economic and Revenue Trends report published by the District of Columbia Office of Revenue Analysis for July 2026. The image highlights that DC jobs declined 5.1% over the last year; federal government accounted for 24.6% of all wages in DC; at mid-year 2025, DC’s population was estimated to be 2,335 or 0.3% higher than the prior year; the office vacancy rate has increased to 18.7%; single-family home sales were up 5.1% from a year earlier, while the average home price was 3.3% lower; condo sales were down 8.4% from last year and the average price was 2.7% lower; and, there were 2.6% fewer hotel-room-days sold than a year ago. The report highlights changes in employment, wages, office vacancy rate, single-family home sales, condo sales, and hotel-room-days. Users can read more by clicking the link in the post.

ALT This data table outlines Washington D.C.’s top ten prioritized economic clusters, ranked by a weighted index score out of 100 that balances feasibility (“Right to win”) and impact (“Want to win”). Federal Government Services holds the highest priority with an index score of 77.8, driven by a massive local talent pool of over 213,000 jobs and a high Location Quotient of 9.0, despite seeing a slight negative local growth rate of -0.5% and a 41% BIPOC workforce. Consulting Services follows in second with a score of 53.9, boasting strong local growth at 5.0% and high average annual wages of $139,000. Technology ranks third at 44.8, showing robust local growth at 4.3% and an even 50% BIPOC representation. Education and Research scores 42.2 with a sizable talent pool of nearly 66,000 jobs, while Communications and Design scores 40.8, commanding the highest annual wages on the chart at $141,000 but holding the lowest diversity rate at 31% BIPOC. More information is available via the link

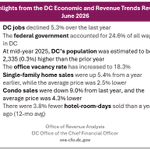
ALT Image reports the highlights from the DC Economic and Revenue Trends report published by the District of Columbia Office of Revenue Analysis for June 2026. The image highlights that DC jobs declined 5.3% over the last year; federal government accounted for 24.6% of all wages in DC; at mid-year 2025, DC’s population was estimated to be 2,335 or 0.3% higher than the prior year; the office vacancy rate has increased to 18.3%; single-family home sales were up 5.4% from a year earlier, while the average home price was 2.5% lower; condo sales were down 9.0% from last year and the average price was 4.3% lower; and, there were 3.8% fewer hotel-room-days sold than a year ago. The report highlights changes in employment, wages, office vacancy rate, single-family home sales, condo sales, and hotel-room-days. Users can read more by clicking the link in the post.

ALT Image reports the highlights from the DC Economic and Revenue Trends report published by the District of Columbia Office of Revenue Analysis for May 2026. The image highlights that DC jobs declined 5.2% over the last year; federal government accounted for 25.3% of all wages in DC; at mid-year 2025, DC’s population was estimated to be 2,335 or 0.3% higher than the prior year; the office vacancy rate has increased to 18.3%; single-family home sales were up 1.2% from a year earlier, while the average home price was 3.2% lower; condo sales were down 10.6% from last year and the average price was 2.7% lower; and, there were 3.6% fewer hotel-room-days sold than a year ago. The report highlights changes in employment, wages, office vacancy rate, single-family home sales, condo sales, and hotel-room-days. Users can read more by clicking the link in the post.

ALT This image is a map of Washington, D.C. showing the boundaries of Wards 1 through 8. Numbered red dots (1 through 36) mark the locations of community organizations across the city.

ALT Image reports the highlights from the DC Economic and Revenue Trends report published by the District of Columbia Office of Revenue Analysis for April 2026. The image highlights that DC jobs declined 5.4% over the last year; federal government accounted for 25.3% of all wages in DC; at mid-year 2025, DC’s population was estimated to be 2,335 or 0.3% higher than the prior year; the office vacancy rate has increased to 18.3%; single-family home sales were down 0.3% from a year earlier, while the average home price was 0.3% higher; condo sales were down 10.8% from last year and the average price was 1.5% lower; and, there were 3.6% fewer hotel-room-days sold than a year ago. The report highlights changes in employment, wages, office vacancy rate, single-family home sales, condo sales, and hotel-room-days. Users can read more by clicking the link in the post.

ALT Image reports the highlights from the DC Economic and Revenue Trends report published by the District of Columbia Office of Revenue Analysis for March 2026. The image highlights that DC jobs declined 5.7% over the last year; federal government accounted for 25.3% of all wages in DC; at mid-year 2025, DC’s population was estimated to be 2,335 or 0.3% higher than the prior year; the office vacancy rate has increased to 18.3%; single-family home sales were down 1.3% from a year earlier, while the average home price was 1.9% higher; condo sales were down 9.4% from last year and the average price was 0.0% higher; and, there were 3.9% fewer hotel-room-days sold than a year ago. The report highlights changes in employment, wages, office vacancy rate, single-family home sales, condo sales, and hotel-room-days. Users can read more by clicking the link in the post.

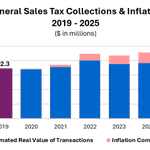
ALT This image shows annual General rate (retail) sales tax collections from 2019 to 2025. Each year’s total (represented by the bars) is divided into the inflationary portion, indexed to 2019, and the real, inflation adjusted portion. The 2025 amount was 38.9 percent higher than the FY 2019 level in nominal terms. After adjusting for inflation, we find that 17.8 percent of the retail tax collections in 2025 were due to inflation.

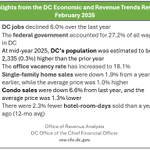
ALT Image reports the highlights from the DC Economic and Revenue Trends report published by the District of Columbia Office of Revenue Analysis for February 2026. The image highlights that DC jobs declined 6.0% over the last year; federal government accounted for 27.2% of all wages in DC; at mid-year 2025, DC’s population was estimated to be 2,335 or 0.3% higher than the prior year; the office vacancy rate has increased to 18.1%; single-family home sales were down 1.9% from a year earlier, while the average home price was 1.0% higher; condo sales were down 6.6% from last year and the average price was 1.3% higher; and, there were 2.3% fewer hotel-room-days sold than a year ago. The report highlights changes in employment, wages, office vacancy rate, single-family home sales, condo sales, and hotel-room-days. Users can read more by clicking the link in the post.

ALT The image is of a graph that shows nominal restaurant sales tax revenue grew by 27.1 percent from 2019 to 2025. But during the same period, average restaurant prices across the District increased by 33.2 percent. After accounting for price increases, we find that restaurant sales volume declined 15 percent. The observed growth in restaurant sales tax revenue over this period was driven solely by rising prices, not by increased sales.

ALT The image shows a bar chart for those with a Master’s degree or higher that separated from federal employment in the District of Columbia in 2025. The highest bar, Master’s degree, reported 8,266 individuals separating from federal employee in the District and the second highest, First Professional, 3,350. The total of these separations accounted for 47 percent of the total federal separations in the District in 2025, and 53 percent of total lost wages, or $2.4 billion.

ALT The image shows a bar chart reporting the federal separations by month for the year of 2025, for federal employees that report to the District of Columbia. The largest month of separations is highlighted in this bar chart as September 2025 with 10,890 federal employees reporting as separated from federal government employment.

ALT The image shows a bar chart with three charts for the Rate of In-migration of Current Millennial Tax Filers in the District of Columbia between 2018 to 2022. The first bar is for years of in-migrations 2008-2012 which represents 8.7 percent of the total millennial tax filers share. The second bar shows that the 37.7 percent of millennial tax filers in-migrated to the District between 2013 and 2017. Finally, the last bar shows the remaining 53.6 percent in-migrated to the District between 2018 and 2022.

ALT The image shows a summary statistics table for DC Millennials by two categories: Newcomers and Longtimers. The statistics are for 2022, ranging from Average Annual Income, number of tax filers, total reported income, tax filing status, average household size, number of homeowners, average home value, average total household income for homeowners, average estimated housing cost burden for renters, average estimate housing cost burden for homeowners, and those that are reported as living with parents in their parent's DC Homesteads.

ALT The image shows an area chart of in-migration and out-migration by age of residents over the period of 2019-2023. The chart demonstrates that a large portion of DC's in-migration happens most around 23, and that the most popular age of out-migration 25-27 from the District.

ALT The image shows a Figure from the blow post about the Distribution of in-migration to DC between 2019 through 2023 by age-generation of resident. The data indicates that Gen Z is becoming a larger share of the in-migration on an annual basis to DC.

ALT The image shows two graphs from the blog post. The first graph to the left reports annual in-migration of new tax filers to the District of Columbia by quarter from 2019 thru 2023. This graph shows the majority of in-migration occurs during quarter 3 of a year. Whereas the second graph to the right shows annual out-migration of former tax filers by quarter for the District between 2019 thru 2023. Both quarters 2 and 3 were nearly equal for individuals moving out of the District of Columbia within a given year. Quarter 2 of 2020 had a significant effect on the out-migration in 2020 that may have contributed to the significant increase in out-migration in quarter 3 of 2020.

ALT The image shows a graph for DC Jobs vs. DC Resident Employment from January 2020 through January 2026. Using January 2020 as the base, the line graph shows the difference over time where less than 100 would be a loss from January 2020 and greater than 100 shows a gain from January 2020. As of January 2026, total jobs in the District are 92 percent of January 2020 levels; whereas, DC Resident Employment is 101.8% of January 2020 levels.


ALT The image in this post shows the difference of Homestead Owners in the District of Columbia between 2014 and 2024. In 2014, women accounted for 38.3% of homestead ownership, whereas men accounted for 61.7%. By 2024, women accounted for 47.6% vs men, who only accounted for 52.4% by this time.