

In crypto since 2017 | Alpha Research | Airdrops 🪂 | Trading
Access to alpha here 👉
Joined April 2023
- Tweets5.8K
- Following63
- Followers2.1K
- Likes4K


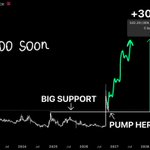
$ONDO really knows how to test everyone's patience.
Pumped to $0.60, dumped back to $0.40
and now everyone is questioning the whole setup. 💀
But here's what I like.
The daily is still holding rising support
and the bigger reversal scenario isn't dead yet.
$0.70 → $1.13 are the levels I'm watching.
Imagine ignoring $ONDO at $0.40 just to FOMO back in above $1.
Classic crypto behavior.

$RENDER went from being an AI market
darling to trading at $1.59 like the entire narrative never existed. 💀
But look at that weekly chart.
We're back in the same zone that preceded some of its biggest rallies.
$5.51 → $11.95 → $13.84.
And $18+ if the next AI cycle gets completely out of hand.
The potential upside is insane.
The question is whether anyone has the patience to catch it before the hype returns.

$PYTH at $0.067 might be the most boring chart hiding the most ridiculous opportunity. 💀
Two years of lower highs.
Almost every rally sold.
And now price is barely moving near the floor.
But imagine this thing finally breaks the cycle.
$0.24 → $0.54 → $1.15.
That's the bullish roadmap I'm watching.
A potential 20x comeback sounds completely insane.
Then again, nobody ever got excited about a chart before it started moving.

$TIA went from $21 to $0.47
and now we're drawing arrows all the way back to $21.
Crypto is genuinely insane. 💀
But look at the weekly.
Price is sitting near a critical long-term floor
after almost three years of getting destroyed.
$9.24 → $11.89 → $21.12 is my dream comeback scenario.
Of course, we need an actual reversal first.
But imagine the absolute chaos if $TIA ever pulls this off.

$INJ bulls are drawing $95 targets while price is fighting for its life at $7.40.
LMAO.
But hear me out.
2021 gave us $25. 2024 pushed toward $50.
And now we're back at the same long-term support zone.
If that floor survives, the third cycle could be absolutely ridiculous.
If it breaks? That beautiful $95 arrow becomes modern art. 💀

$DASH at $48 with a $1,600 target on the chart.
Yeah, I know how ridiculous that sounds. 💀
But zoom out.
Years of price action compressed near the floor.
The entire 2021 rally feels like ancient history.
Now imagine this thing actually enters a new bull cycle.
$500 would already be chaos. $1,600 is the full-degen scenario.
The base is there. The breakout isn't.
Yet.

$FIL at $0.87 with a chart pointing toward $430.
I had to look at that twice. 💀
This thing went from being one of the biggest names in crypto to trading for less than a dollar.
Now the weekly is sitting near a multi-year floor.
$119 → $237 → $430 are the wild bull-case targets.
A 500x comeback from here would be absolutely ridiculous.
First, we need an actual reversal.
Then we can start discussing the madness.

$ARB at $0.16 is either a generational opportunity or the most expensive lesson in catching falling knives. 💀
Look at that weekly chart.
Years of bleeding, a massive base near the lows
and barely any signs of life.
But if this thing finally wakes up?
$0.61 → $1.22 → $2.42.
And $3.50 in a full-blown mania scenario.
The upside is ridiculous.
The hard part is surviving long enough to see it.

$BCH at $284 might be one of the most overlooked setups in crypto right now.
Think about it.
2021 ATH at $1,644. Five years later, we're sitting 83% below that level, and barely anyone cares.
A massive liquidity zone below, another brutal correction, and a potential 10x scenario staring us in the face.
$2,400 sounds completely insane.
But I'm starting to think the real insanity is ignoring this chart.

$QNT might be setting up for something absolutely ridiculous.
It already showed us what happens
when buyers step in.
Now price is back at the $170 breakout zone.
If this level holds, I wouldn't be surprised to see $300+ again.
And $700? That's my crazy bull-case target.
A potential 4x from here.
The entire setup comes down to one question:
can bulls defend $170?

$AERO is setting up for something BIG.
Trading around $0.68, and the chart is looking interesting.
Targets I'm watching:
$1.58
$2.22
$3.70
That's a potential 1,000% move.
Most people will ignore $AERO now and start chasing it when it's already up 300%.
I've seen this movie before.
Not saying it's guaranteed, but I'm definitely not sleeping on this one.

$DASH has been left for dead for years.
And that's exactly why I'm watching it.
While everyone chases the same 5 trending alts
$DASH is sitting near a massive historical accumulation zone.
$147. $285. $477.
Those are the levels I'm watching.
Could it really pull an 8,000% move?
Sounds insane.
But crypto has a habit of making the impossible look obvious in hindsight.

$WLD is down 96% from its peak.
And somehow, this is exactly where things get interesting.
Years of selling. Almost zero excitement. Price sitting near historical lows.
Everyone loved $WLD at $10. Nobody wants it at $0.43.
Funny how that works.
I'm watching for a reversal.
If momentum returns, the upside could be absolutely insane.

$ONDO at $0.41.
And people are still waiting for a better entry? ahaha
Look at that daily chart.
Higher lows. Strong support. A potential reversal forming right in front of us.
My target is $1.50.
That's over +250% from here, with the chart showing even more upside potential.
I think $ONDO could surprise a LOT of people.
The question is whether this support holds.

$BNCB is looking ready to explode.
While everyone is chasing pumps
I'm watching this setup.
Higher lows.
Strong support.
Price holding around $5.85.
And that trendline points toward $15.
That's a potential +247% move.
The breakout isn't confirmed yet
but this is exactly the kind of setup I like catching early.
$BNCB could get interesting fast.


$TAO AT $251.
And I'm still looking at $1,300+.
Call me crazy, but this weekly chart is interesting.
Months of sideways movement.
A massive support zone around $200.
And a long-term downtrend that could finally be losing strength.
Most people will wait until $TAO is back above $600 to get excited.
Me? I'm watching it right here.
The upside to my target is around 472%.
Of course, support can still break.
But if momentum returns, I think $TAO could move much faster than people expect.

$RAY peaked near $17.87 in 2021.
Then it collapsed over 95%, and almost everyone forgot about it.
Now we're seeing another potential accumulation zone near the bottom of its historical range.
Here's what people underestimate:
Crypto doesn't need everyone to believe in a recovery.
The biggest moves often begin when almost nobody expects one.
If Solana's ecosystem enters another major expansion
I think $RAY could surprise a lot of people.
My aggressive target is $30.
That's nearly 17x from here.
Of course, this setup depends on the support holding and a genuine trend reversal developing.
But I'd rather be watching $RAY at $1.77 than chasing it after a 500% rally.

$XDC TO $0.21? THIS SETUP LOOKS INSANE.
$XDC is sitting around $0.033, and almost nobody is talking about it.
Look at the weekly chart.
Every major rally started when the market had completely lost interest.
And right now, we're back near that same historical accumulation area.
My targets:
$0.1026
$0.1540
$0.1943
The extended scenario points toward $0.21
roughly +708% from the chart's projected starting point.
I don't expect a straight line up.
But if buyers reclaim the previous resistance levels
things could get interesting very quickly.
The funniest part is that people will probably call $XDC a great opportunity at $0.15.
But at $0.033? Nobody wants it.
That's how crypto works.

Almost everyone who bought $FIL over the past 5 years is underwater.
But here's what interests me.
The weekly chart shows price sitting near its historical lows after years of relentless selling.
My long-term targets:
$118.86
$237.39
$430.21
Yes, the full scenario implies over 36,000% upside.
Sounds insane.
And frankly, it would require an extraordinary comeback, not just a normal bull market.
I'm not saying $FIL will hit those numbers.
Old highs don't guarantee future demand.
But this is exactly the kind of chart I want on my radar when sentiment is completely dead.
Would you risk buying $FIL below $1?
